
Figure 3.
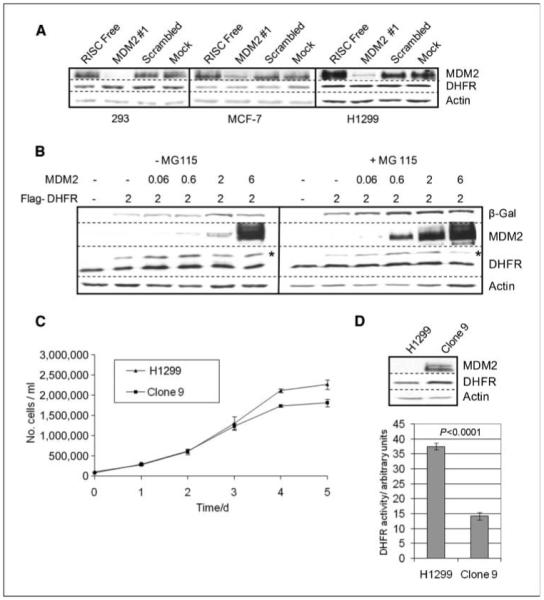
MDM2 does not alter the level of DHFR, but cells with stably overexpressed MDM2 have lower DHFR activity. A, SDS-PAGE and immunoblot analysis of the indicated cell lines transfected with the indicated siRNA molecules. B, H1299 cells were transfected with the indicated plasmids (*, band corresponding to the slower migrating Flag-tagged DHFR) and were either treated with MG115 or mock-treated with diluent to inhibit proteasomal activity. C, H1299 cells and a derivative line that stably expresses high levels of MDM2 (H1299-clone 9) display similar growth characteristics (in the experiment shown, six independent cultures of each cell line were measured; n = 6). D, bottom, spectrophotometric DHFR assay of H1299 and H1299-clone 9 cell lysates. Statistical analysis by Student’s t test, n = 4 (four independent cultures were analyzed for each cell line). Top, levels of the indicated proteins detected by immunoblotting. Columns, mean; bars, SE. The experiments have been repeated on at least three occasions, and the results presented are from a single typical experiment.