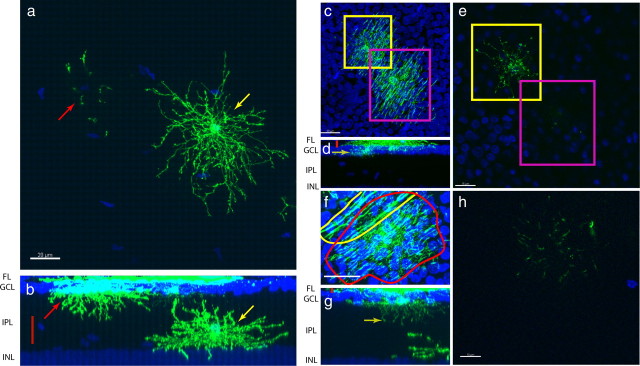
Figure 4.
Post-hatch migration of astrocytes into the IPL and variable diacyte projection into the IPL. a, MIP of an IPL astrocyte (yellow arrow) and processes of an astrocyte with a cell body in the GCL (red arrow). b, Cross-sectional MIP showing GCL astrocyte (red arrow), IPL astrocyte (yellow arrow), and area shown in a (red bar). Scale bar, 20 μm. c, MIP of two diacytes observed from the fiber layer, highlighted in the yellow and magenta boxes. d, Cross-sectional MIP showing the area imaged in c, red bar. Yellow arrow indicates the single confocal slice shown in e. e, Single confocal slice showing one of the cells extending very short processes into the IPL (the yellow-boxed cell in c), whereas the other cell did not extend any processes into the IPL (the magenta-boxed cell). f, MIP of a diacyte (red outline) and an oligodendrocyte (yellow outline). g, Cross-sectional MIP of a diacyte extending processes deep into the IPL. Red bar indicates area depicted in f. Yellow arrow indicates slice shown in h. h, Single confocal slice deep in the IPL showing extensive diacyte processes in the IPL. Scale bars: a, d, 20 μm; c, 15 μm; f, 10 μm. INL, Inner nuclear layer.

