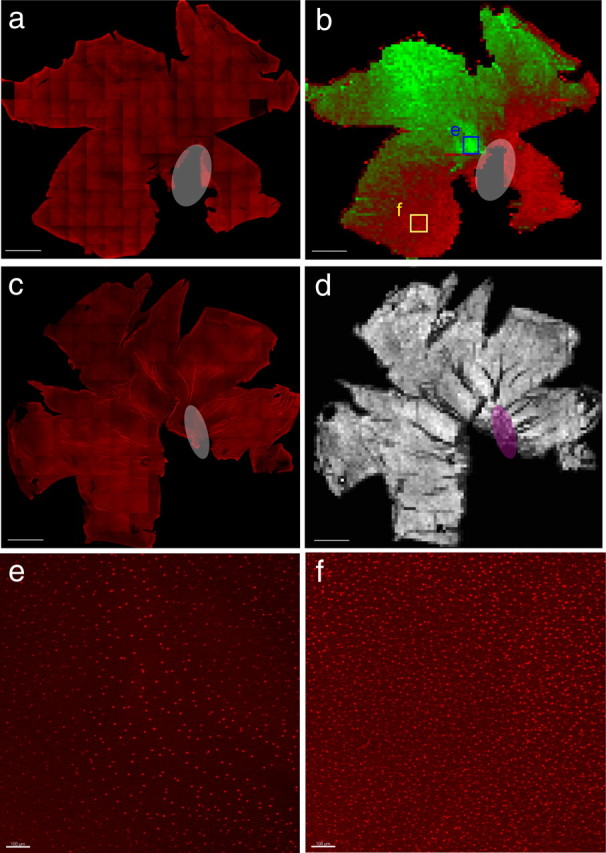
Figure 8.

Quantification of Olig2 and neurofilament staining in the P8/9 chick retina. a, Tiled confocal image of the chick P8/9 retina stained for Olig2 (red). b, Pseudocoloring of the automated quantification of Olig2+ cells on the vitreal surface of the retina. Red indicates relatively higher Olig2+ cell density, and green indicates relatively lower cell density. Note the ventral high Olig2 density and dorsal low Olig2 density as well as the spot (outline) in the central retina of very low Olig2 density. The red rim surrounding the retina is an automated quantification artifact. Each pixel corresponds to a single quantified bin and is equivalent to an ∼150 × 150 μm area of the retina. c, Tiled confocal image of the chick P8 retina stained for neurofilament to mark retinal ganglion cell axons (red). d, Quantification of the number of filaments on the vitreal surface of the retina shown with black being low and white being high, indicating no significant difference in the number of axonal fascicles throughout the retina. Each pixel is also equivalent to an ∼150 × 150 μm area of the retina and corresponds to a single quantification bin. Scale bar, 2500 μm. White and magenta ovals indicate ventral fissure. e, MIP corresponding to blue box in b. Scale bar, 100 μm. f, MIP corresponding to yellow box in b. Scale bar, 100 μm.
