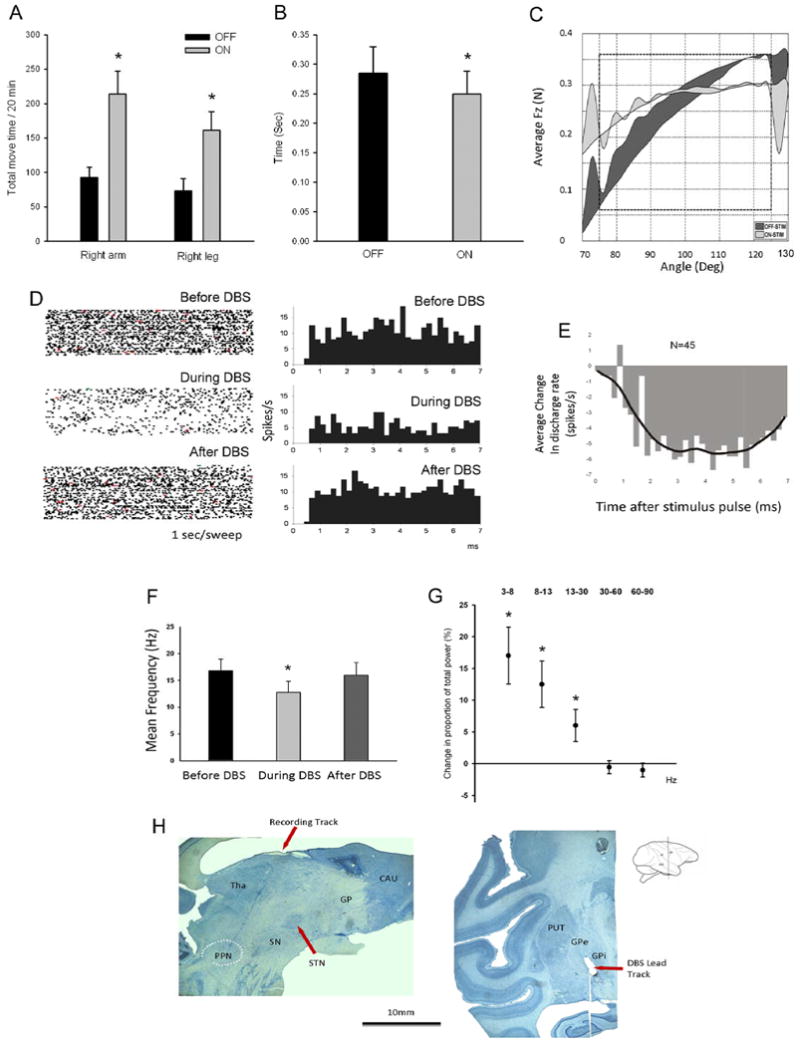
Figure 1.

Panel A: total movement time of the right upper and lower extremity during a 20-minute cage behavior analysis. The y-axis shows the total movement time in seconds. Panel B: sum of total movement time in the reach and retrieval task before and during GPi DBS, showing behavioral improvement in bradykinesia. Y axis is in seconds. For this and the following panels, significance is marked by *, and standard errors are shown by bar plots around the mean. Panel C: changes in all rigidity measures induced by GPi-DBS in this monkey (reprint from (Nitta, et al., 2009) with permission). In the DBS-on state, the averaged Fz versus angle plot showed a substantial decrease in area and slope. Panel D: raster plots (left) at 1 second/sweep and perievent histograms (right) illustrating discharge activity for one, typical PPN neuron, before, during and after GPi DBS. During the stimulation, the events are counted on a 7 ms cycle (corresponding to the 135 pulse per second DBS). Events of the before and after states were counted also in a 7 ms cycle, based on a computer-generated pulse-timing event. The first bin is omitted because of signal saturation and residual stimulation artifacts. X axis: time in milliseconds after the stimulation pulse or computer-generated pulse-timing event. Y axis: spikes per second. Panel E: changes (OFF-ON) in the averaged post stimulation time histogram (PSTH) of all the PPN neurons during GPi DBS, showing inhibition of neuron firing. The responses for each animal are illustrated by the bars and the continuous line (Kolmogorov-Smirnov goodness of fit test). The bars were determined by subtracting the response during stimulation from that which occurs during the control period before stimulation. X axis: time in milliseconds post the stimulation pulse. Y axis: spikes per second. Panel F: Mean discharge frequency of PPN neurons before, during and after GPi DBS, showing decreased neuronal activities during the stimulation. Panel G: The mean change in proportion of total power in the PPN population neuronal activity during the DBS ON relative to the DBS OFF state. Five frequency bands are examined: 3-8 Hz, 8-13 Hz, 13-30 Hz, 30-60 Hz and 60-90 Hz. Panel H: Histology of monkey brain. Left: Sagittal view of the brain showing the recording track going through the thalamus to the PPN (white dashed oval). Right: Coronal view of the brain showing the tip of DBS lead located in the dorsal posterior area of GPi.
