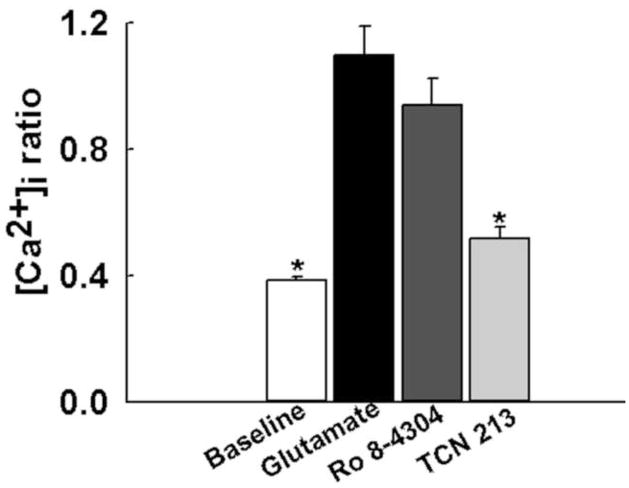
Fig. 3.
The role of NMDA receptor subtypes on [Ca2+]i upon glutamate stimulation. Prior to glutamate stimulation, the average baseline ratio value was 0.38±0.01. When stimulated with 50 μM glutamate, ratio values increased to 1.09±0.09. When neurons were stimulated with glutamate (50 μM) in the presence of GluN2B selective antagonist Ro 8-4304 (10 μM) 340/380 ratios increased to 0.94±0.08, which were not significantly different from glutamate alone conditions. When stimulated with GluN2A selective antagonist TCN-213, 340/380 ratios increased to 0.52±0.04, which were significantly lower than control glutamate levels. *P<0.001 compared to glutamate, one-way ANOVA followed by post-hoc Dunnett’s test, n=7 plates per condition.

