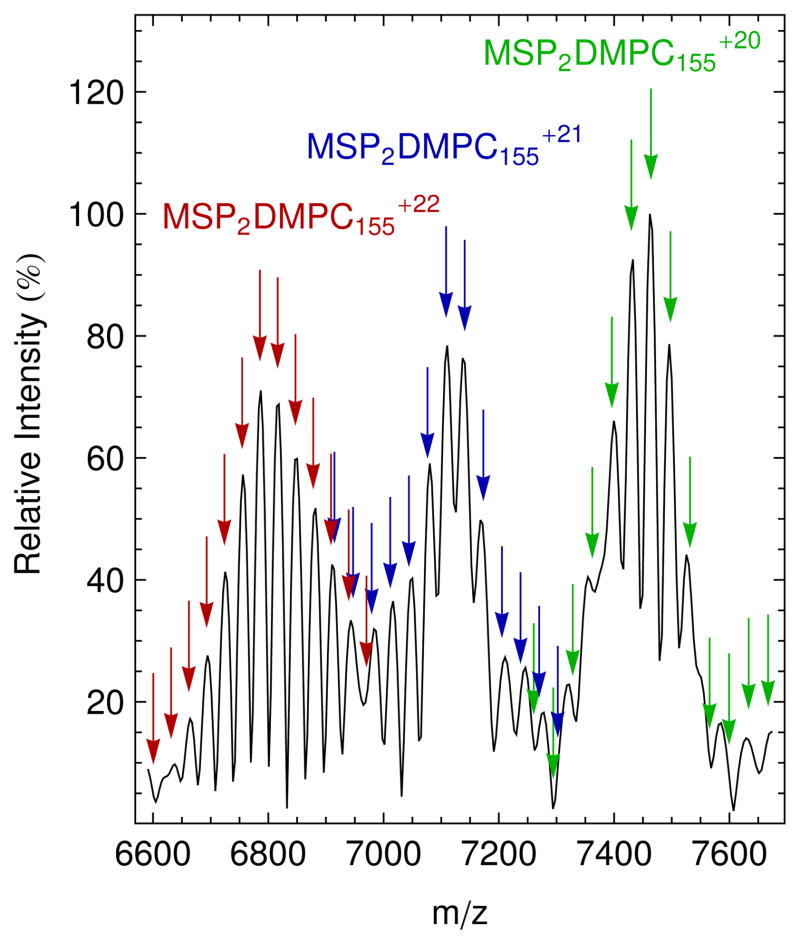
Figure 1.
Native mass spectrum at 70 V CAD of DMPC Nanodiscs (black) with simulated masses of the +22 (red), +21 (blue), and +20 (green) charge states for Nanodisc complexes with two MSP molecules, six bound water molecules, and an average of 155 DMPC molecules. Arrows of the same color show simulated values for Nanodiscs in the same charge state with a varying number of lipid molecules. The average, 155 lipids, is the highest peak in each charge state. Simulated m/z values are marked by the arrows, and their vertical position was matched with the intensities of mass spectrum.

