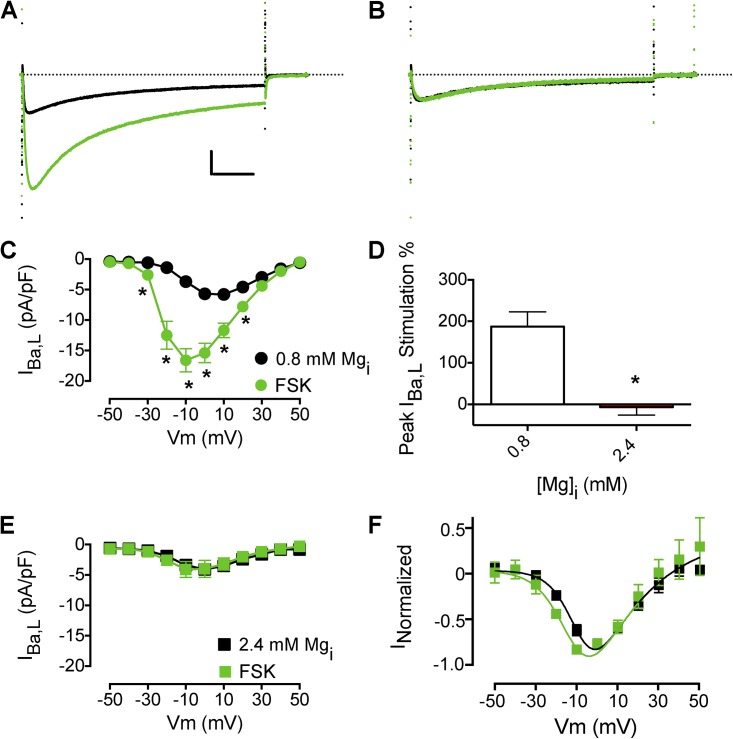
Figure 3.
Effects of Mg2+i on adenylate cyclase stimulation of IBa,L. (A) Effect of 10 µM forskolin (FSK) on peak IBa,L (black IBa,L traces are before FSK perfusion). Calibration bar: 2.5 pA/pF, 50 ms. (B) Effect of forskolin on peak IBa,L with 2.4 mM Mg2+i. (C) Mean I-V relationship from experiments with 0.8 mM Mg2+i as described in A (n = 10). (D) Mean peak stimulation of IBa,L with forskolin. (E) Mean I-V relationship with 2.4 mM Mg2+i as in B. (F) I-V relationship from E normalized to maximum conductance values at V = 10–30 mV. The dotted lines in A and B represent zero current level. Data are presented as mean ± SEM (some errors are smaller than the symbols; *, P < 0.01).

