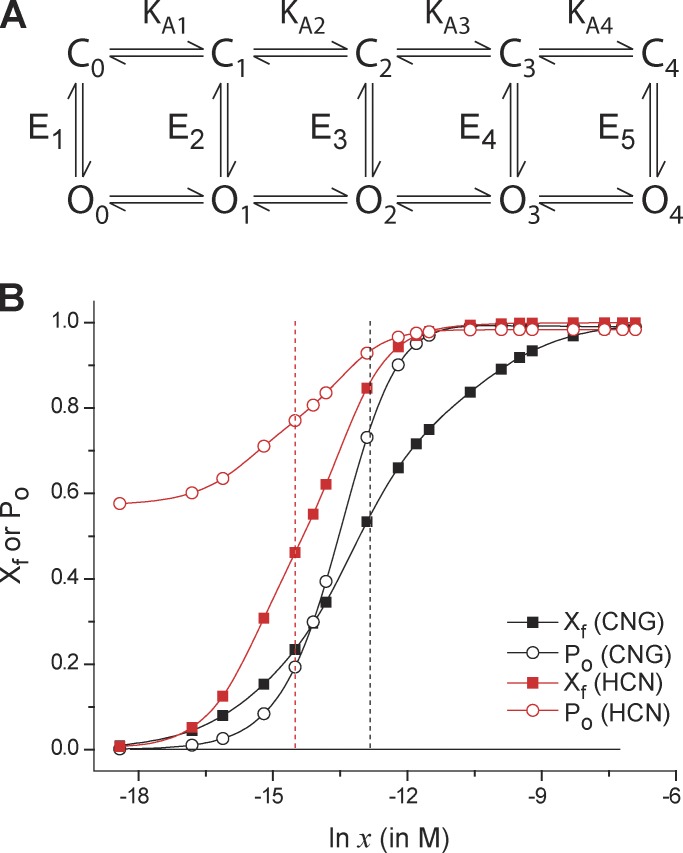
Figure 4.
Comparison of median estimates of free-energy change in CNG and HCN channels. (A) The proposed model of the ligand-induced activation pathway of the CNG and HCN channels. There are five open and closed states (labeled Oi and Ci, (I = 0, 1, 2 …, 4), where “i” represents the number of ligands bound to state). KAi (i = 1, 2, 3, or 4) indicates the step-wise binding affinities of the ligand in the closed state. Ei (i = 1, 2, …, 5) represents the closed-open equilibrium constant for a unique ligation state of the channel. For the CNG channel, each state is considered to have a multiplicity of 4!/(4 − i)!i! (i = 0, 1, 2, …, 4), whereas for the HCN channel, each of the states are considered to be unique (multiplicity = 1). (B) Using the model parameters provided in Biskup et al. (2007; for the CNG channel) and Kusch et al. (2012; for the HCN channel), the steady-state open probability curves (open symbols) and the fractional binding curves (closed symbols) were simulated. The vertical broken lines represent the median ligand concentration axes (for the binding curves) for the CNG (black) and HCN (red) channels. For the HCN channels, these curves represent the channel response at −130 mV.

