Figure 5.
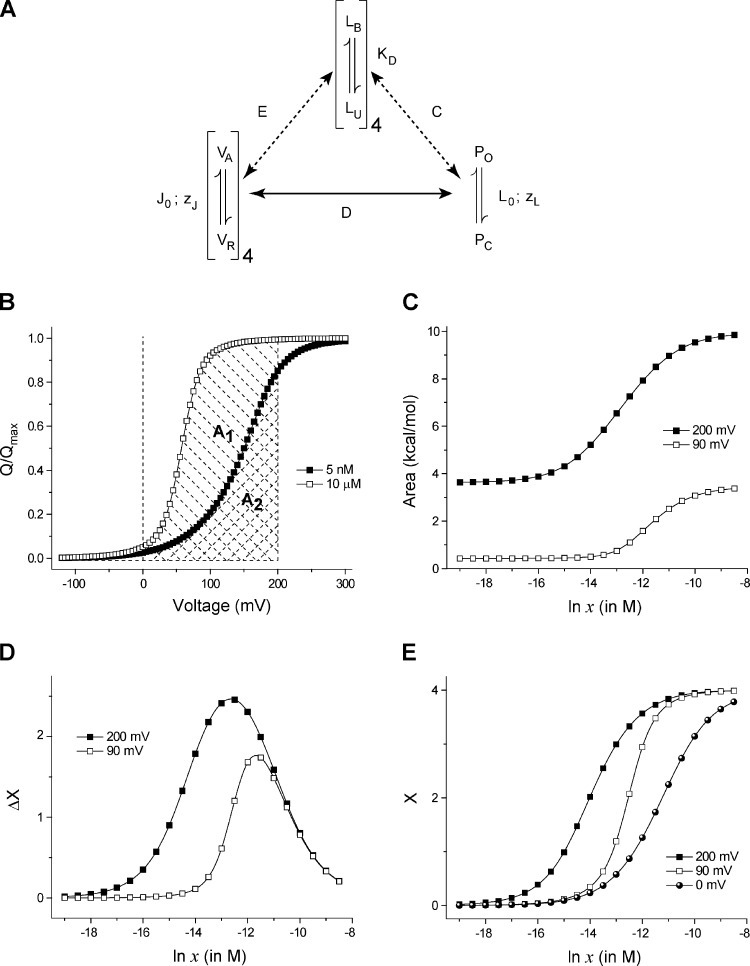
Generating ligand binding curves at different voltages using Q-V curves at different ligand concentrations. (A) The allosteric model proposed for the BK channel (Horrigan and Aldrich, 2002). There are four voltage-sensing domains, four ligand binding sites (one per subunit), and a single pore. Each of the voltage sensors and the ligand binding sites are allosterically linked to the pore. Each ligand binding site is coupled to a single voltage sensor (in the same subunit). J0 and L0 are the voltage-independent components of the equilibrium constants of activation of the voltage sensor and the pore, respectively. zJ and zL reflect the voltage dependence of activation of each voltage sensor and the pore. KD is the dissociation constant of each of the ligand binding sites. The voltage sensor and pore coupling is described by the cooperativity parameter, D. E and C depict the cooperativity parameters describing coupling of the ligand binding sites with the voltage sensors and pore, respectively. The best fit estimates of these parameters (Fit B; Horrigan and Aldrich, 2002) are: J0 = 0.0319, KD = 0.000011, L0 = 9.8 × 10⁻⁷, C = 8, D = 25, E = 2.4, zJ = 0.58, and zL = 0.3. (B) Q-V curves at two ligand concentrations, for the model shown in A. The cross-hashed area (A2) is the area under the Q-V curve at 5 nM ligand concentration, between 0 and 200 mV. The area under the Q-V curve at 10 µM ligand concentration, between 0 and 200 mV, is the total shaded area (A1 + A2, A1 being the area between the two curves). (C) The area under the Q-V curve between 0 and 200 (or 90) mV is plotted against ligand concentration. As the ligand concentration increases, the Q-V curve shifts leftward and thus this area increases as depicted in B. (D) The change in ligand occupancy of the protein caused by increasing the voltage from 0 to 200 (or 90) mV (derived as the gradient of the curves in C) is plotted against different ligand concentrations. In the intermediate ligand concentrations (ln x between −15 and −10), changing voltage brings about a large change in the mean number of ligands bound to the protein, even though the ligand concentration is unchanged. (E) The linkage equation–derived ligand binding curve at 200 and 90 mV, obtained by adding ΔX versus ln x curves for individual voltages to the reference ligand binding curve. In this case, the reference binding curve was simulated from the model parameters.

