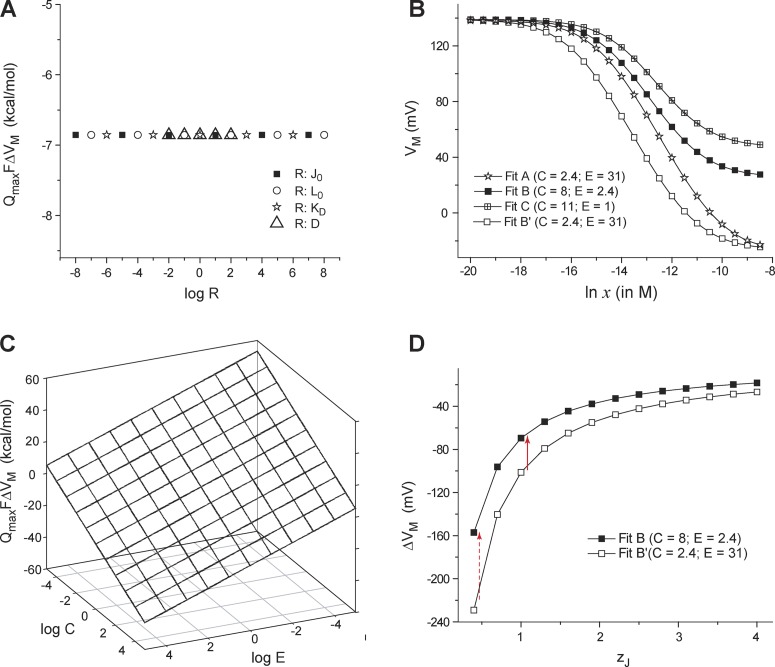
Figure 6.
Dependence of the shift of Q-V curves due to ligand concentration on different parameters of an allosteric model. (A) QmaxFΔVM is plotted against the (logarithm of) a subset of parameter values for the allosteric model of the BK channel (Fig. 5 A). In each case, a single parameter of the model was changed, whereas the others were maintained at the control (Fit B) values. Symbols correspond to different parameters that were varied. For all the four equilibrium parameters tested (J0, L0, KD, and D), QmaxFΔVM remains constant at −6.8 kcal/mol. (B) VM of the simulated Q-V curves is plotted against ligand concentrations for four sets of the BK channel model parameters as described previously (Horrigan and Aldrich, 2002): for Fit A, J0 = 0.03807, KD = 0.000032, L0 = 2 × 10⁻⁶, C = 2.4, D = 18.4, E = 31, zJ = 0.55, and zL = 0.4; for Fit B, J0 = 0.0319, KD = 0.000011, L0 = 9.8 × 10⁻⁷, C = 8, D = 25, E = 2.4, zJ = 0.58, and zL = 0.3; for Fit C, J0 = 0.0319, KD = 0.000011, L0 = 9.8 × 10⁻⁷, C = 11, D = 25, E = 1, zJ = 0.58, and zL = 0.3; for Fit B′, same as Fit B except the coupling terms C = 2.4 and E = 31. (C) QmaxFΔVM was evaluated through simulations for values of C and E, varying over several orders of magnitude, and is plotted against log C and log E. (D) A plot of ΔVM with respect to zJ for Fits B and B′. ΔVM for Fits B and B′ are more significantly different for low values of zJ (red broken arrow) than higher values (red solid arrow).

