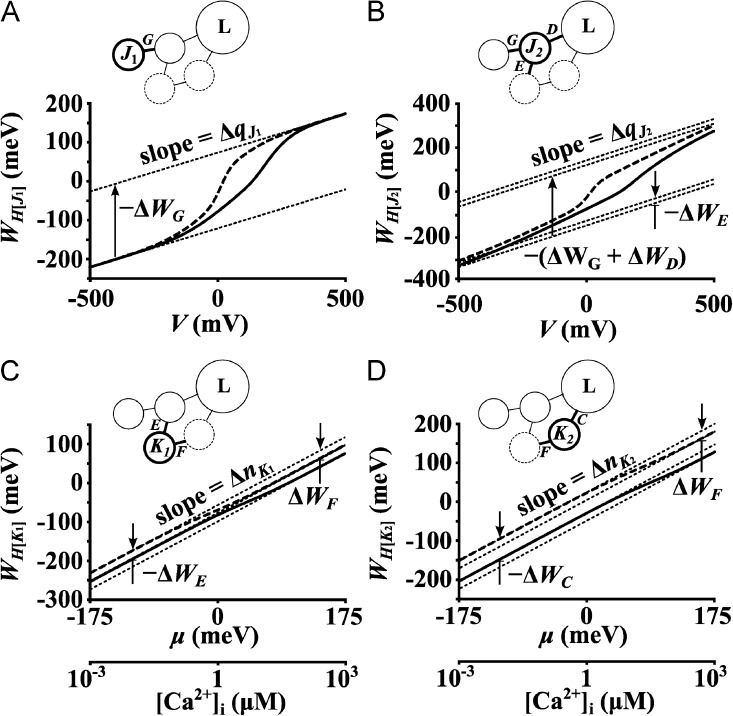
Figure 11.
Hill analysis of J and K particles in Scheme 4. (A and B) J particles: solid lines, [Ca2+]i = 10−3 µM; dashed lines, [Ca2+]i = 103 µM. (C and D) K particles: solid lines, V = −103 mV; dashed lines, V = 103 mV. Asymptotes (dotted lines) were numerically derived. Cartoon representations of a single subunit highlighting relevant interactions are shown above each plot.

