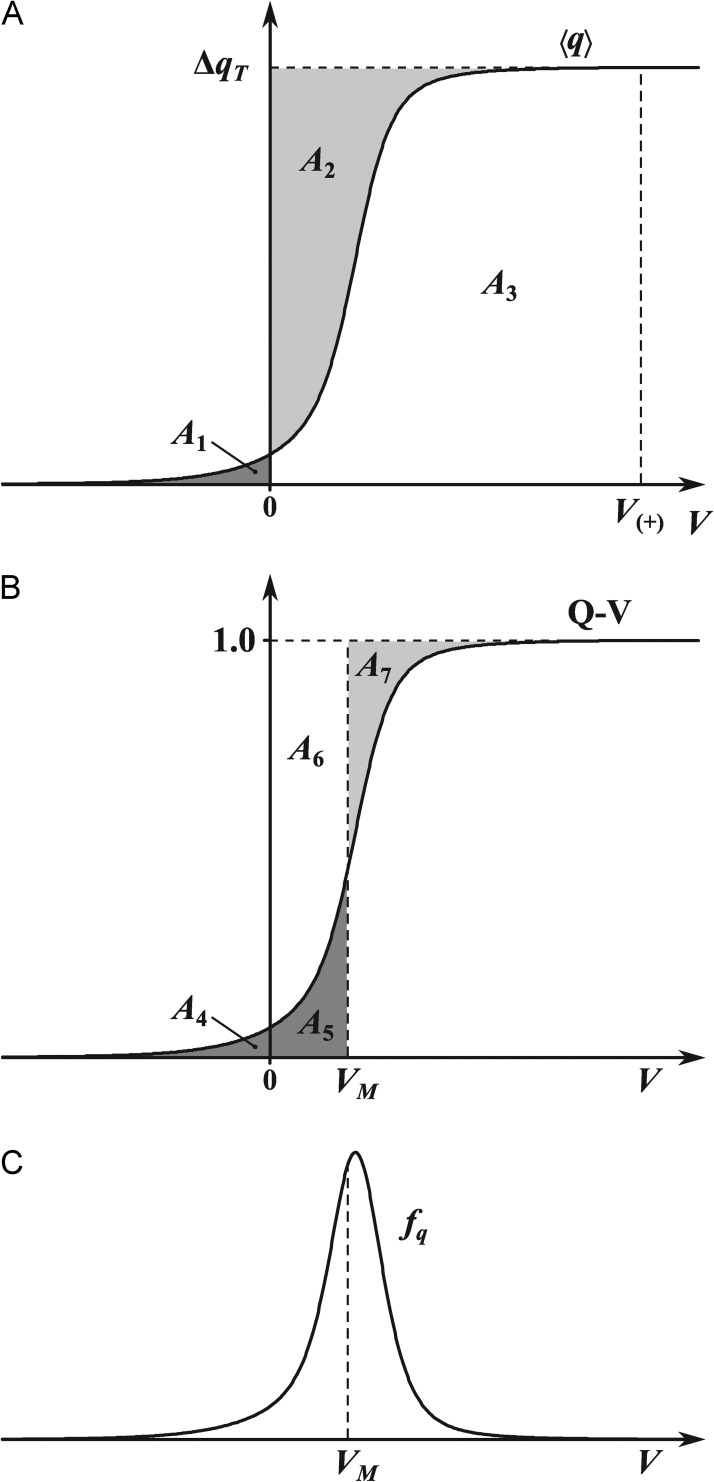
Figure 3.
Q-V plot characteristics. (A) “Single-channel” Q-V plot obtained by dividing gating charge by N. The global work function WC[q] is equal to the difference between the lightly shaded and darkly shaded areas. (B) “Normalized” Q-V plot obtained from dividing by Qmax. The characteristic voltage VM divides the Q-V into equal shaded areas. (C) The electrical capacity distribution: fq = ΔqT−1d〈q〉/dV. The first moment of the distribution is equal to VM.

