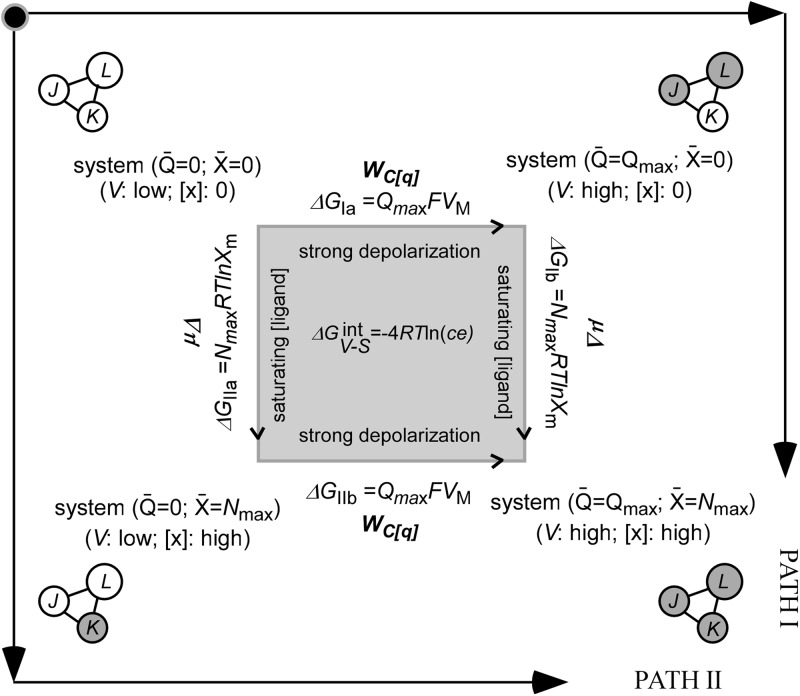
Figure 2.
A thermodynamic linkage cycle for assessing coupling between the voltage- and ligand-dependent pathways (adopted from Fig. 2 of both the Sigg, 2013, and the Chowdhury and Chanda, 2013, papers). The cycle presents the four extreme channel states populated in the absence of any signal (top left, the resting state), where either of the voltage or the ligand signals are saturating (top right and bottom left corners, respectively), or where both signals are turned on, giving rise to the fully open end state (bottom right). The states are either described schematically, as in the Sigg paper (with the P, S, and V domains designated by their respective L, K, and J equilibrium constants), or by text, as in the Chowdhury and Chanda paper. For each transition, the corresponding energies and work functions are indicated above the arrows.

