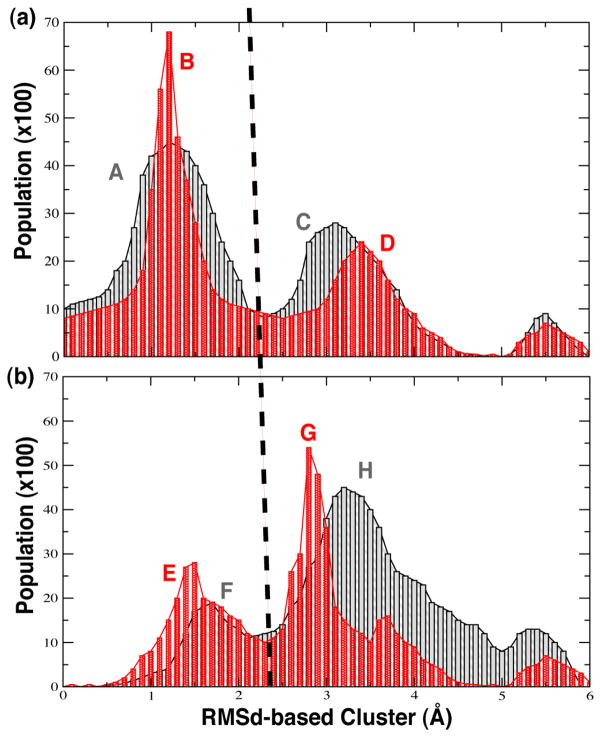
Figure 7.
Conformational distributions from RMSD-based clustering analysis. QM-only results shown in red; QM/MM results shown in gray/black. (a) Results from dynamics at the TSD state. (b) Results from dynamics at the ADP state. Peaks A, B, E and F correspond to TSD conformations; peaks C, D, G and H correspond to ADP conformations.

