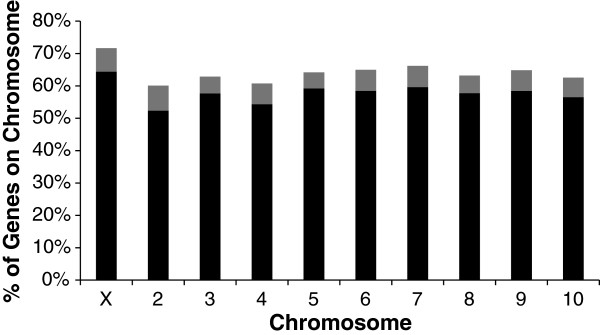
Figure 1.
Expressed Genes by Chromosome. The percentage of total annotated genes on the indicated chromosome that are expressed in 0–24 hour eggs are depicted with the total height of the bar on the graph. The percentages of genes which are maternally loaded into eggs are depicted in black while those additional genes that are only expressed in fertilized eggs are depicted in grey.

