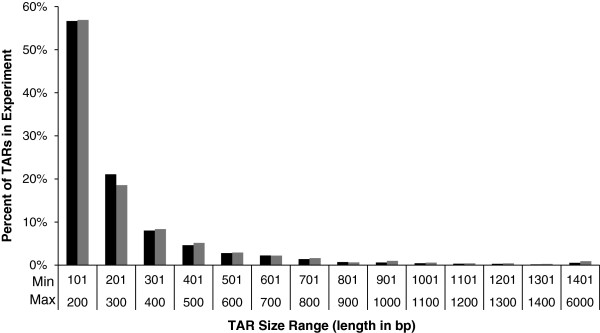
Figure 4.
Size distribution of Transcriptionally Active Regions (TARs) >100 bp. The percentage of total TARs within a given size range expressed in 0–24 hour eggs are depicted with the height of the bar on the graph. The percentages of TARs identified from the unfertilized egg collection are depicted in black while the percentages of TARs identified in fertilized eggs are depicted in grey.

