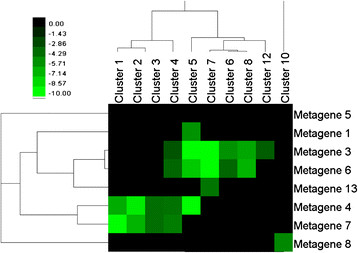
Figure 7.
Heat map of intersection p-values for the pathogen network. Intersection p-values between clusters in the pathogen network from Atias, and the metagenes in this study. Bright green cells represent significant statistical overlap. The intensity of the cells represents a log-10-transformed p-value returned by the hypergeometric test.

