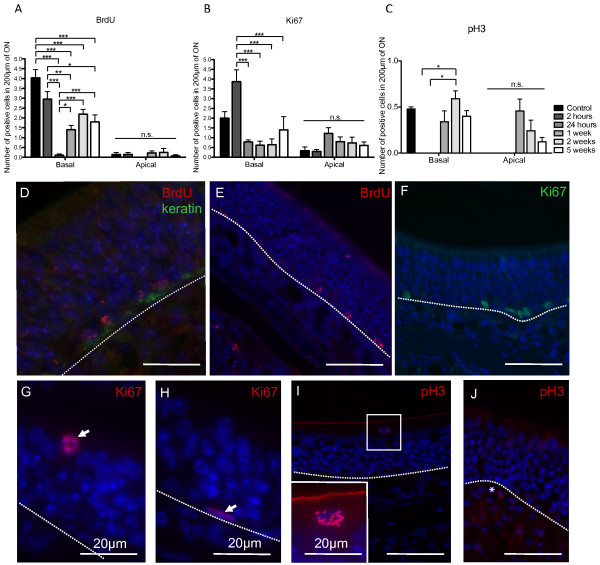
Figure 4.
Analysis of cell cycle markers in the mouse ON following X-ray irradiation.A,B,C, Proliferation in the ON for different time points following X-ray irradiation, as quantified by A, BrdU incorporation (F(11,78) = 28.02, p ≤ 0.0001, n=3 mice); B, Ki67 expression (F(11,40) = 7.622, p ≤ 0.0001, n=3 mice); C, pH3 expression (F (11,40) = 4.369, p = 0.0003, n=3 mice). * p ≤ 0.05, ** p ≤ 0.01, *** p ≤ 0.001, n.s. not significant. D,E, BrdU was mainly observed on cells lying on top of the basal lamina (keratin). Ki67 expression at 2 hours in the basal lamina (F), in the sustentacular cell layer at 1 week (arrow) (G) and a horizontal basal cell positive for Ki67 at 2 weeks (arrow) (H), pH3 expression in the sustentacular cell layer at 5 weeks (I) and in the lamina propria at 2 weeks (J *). Dashed lines indicate basal lamina. All sections have nuclei counterstained with DAPI (blue). Scale bars: D-F,I,J, 50 μm.

