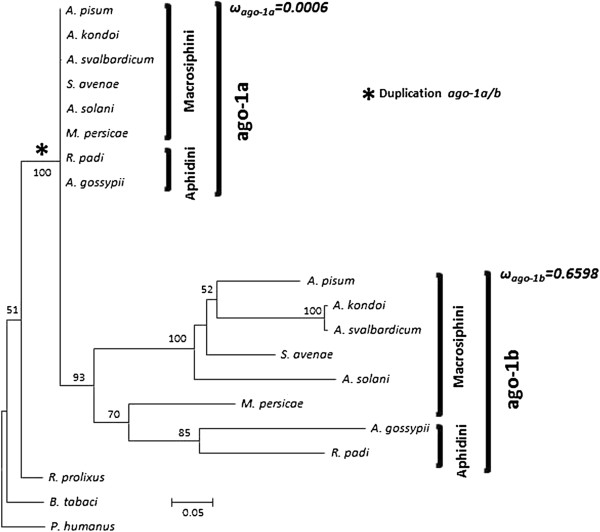
Figure 1.
Maximum likelihood tree inferred from the amino acid concatenated alignment of ago-1 sequences (model JTT+G+F). The same topology was found using maximum parsimony and Bayesian inference, with only slight differences in the relationships inside the ago-1b group. For those species for which two alleles were obtained only one consensus sequence was included, since no correlation could be made between different alleles of the three different regions. An asterisk (*) marks the suggested moment of the duplication of ago-1. Bootstrap values are shown only when higher that 50%. For each copy of the gene, the value of the ratio of non-synonymous to synonymous rates (ω) resulting from the “two-ratio” model is shown (see Results). The value was calculated as the weighted mean among the ω values of the three coding nucleotide regions analyzed. A strong purifying selection characterizes the ago-1a sequences, contrasting with relaxed selection of ago-1b.

