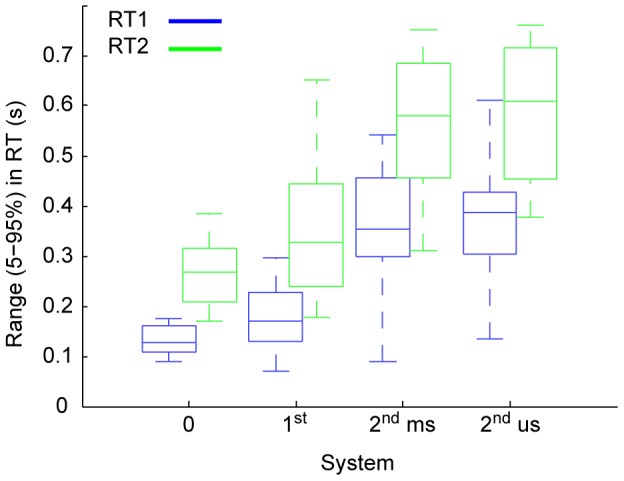
Figure 4. Group results: Ranges.

The inter-participant (13 in each system condition) ranges (5–95%) in RT1 (blue) and RT2 (green). Each box shows, the median range (central mark), the 25th and 75th percentile range (the edges of the box are), and the most extreme data points not considered outliers (the whiskers) of these ranges. The maximum whisker length is 1.5. Data points are drawn as outliers ‘+’ if they are larger than q3 + w(q3 - q1) or smaller than q1 - w(q3 -q1), where w is the whisker length and q1 and q3 are the 25th and 75th percentiles, respectively.
