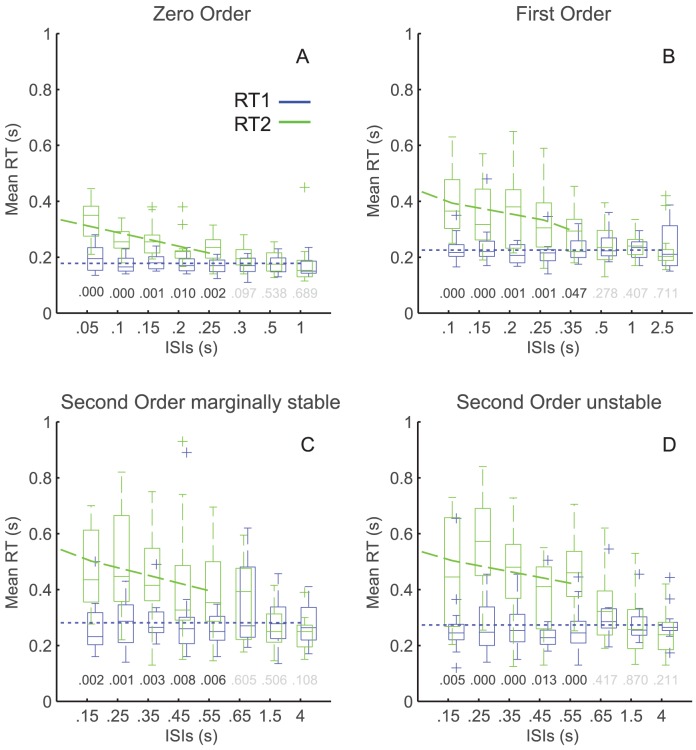
Figure 5. Group results: statistical analysis of Mean delays (stage 2).
The four panels: Zero Order System (A), First Order System (B), Second Order marginally stable System (C), Second Order unstable System (D), show the inter participant mean RT1 (blue) and RT2 (green) against ISI for the reversed step-pairs stimuli only (for details regarding the box plot’s constituents see caption Fig. 4). The P-values of the ANOVA’s post hoc test are display above each ISI level (black if significant, gray if not). The blue dotted line shows the mean RT1, the dashed green line shows the unconstrained regression linear fit between (interfered) RT2 and ISIs.

