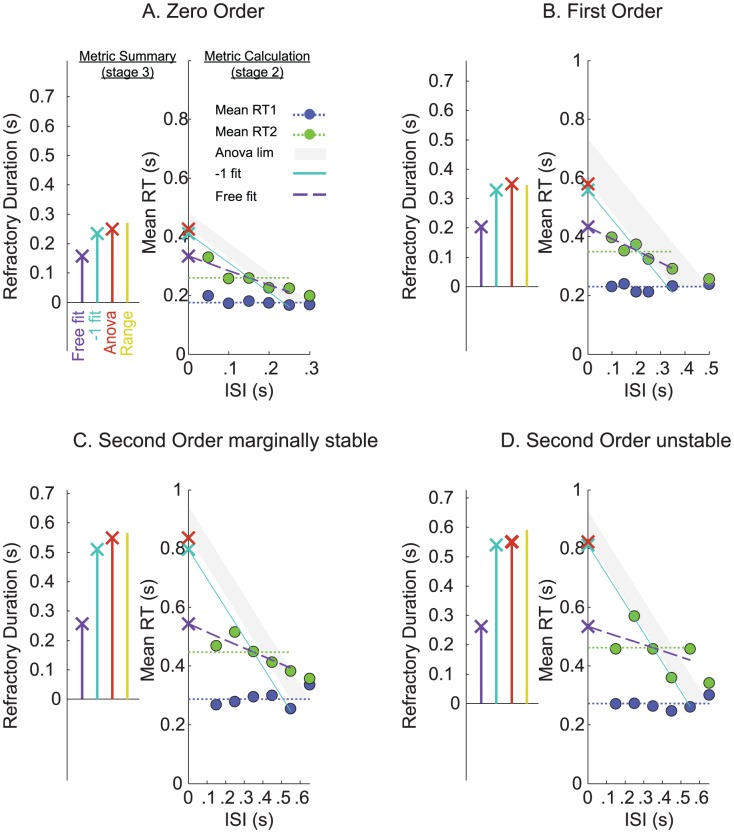
Figure 6. Estimates of the refractory duration.
The four panels: Zero Order System (A), First Order System (B), Second Order marginally stable System (C), Second Order unstable System (D), show -in the right axes- how each metric is calculated. Plotted as a function of ISI are mean RT1 (blue circles) and mean RT2 (green circles). The gray area describes the lower and upper limits of the ANOVAs ‘general linear model’ significance, the cyan solid line shows the least mean squares fit between RT2 dependent upon ISI with slope constrained to −1, the magenta dashed line shows the unconstrained regression linear fit between RT2 dependent upon ISI, crosses displayed on the y-axes show the intercepts of these function, and the dotted blue line shows the mean RT1 which served as a baseline for the left axes that summarizes the four estimates of the refractory duration: the intercept of the unconstrained regression fit (magenta), the intercept of the −1 regression fit (cyan), the ANOVA metric (brown), and the Range in RT2 (yellow).

