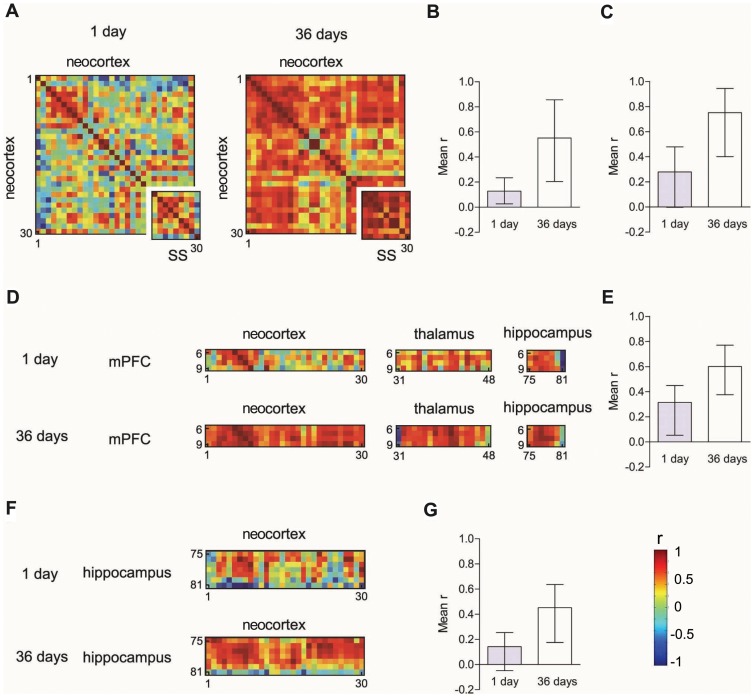
Figure 4. Functional connectivity changes as a function of memory age.
A. Color-coded matrices showing inter-regional correlations for Fos expression within the neocortex at the short (1 day) and long (36 days) retention delays. The inset matrices correspond to inter-regional correlations for subregions of the somatosensory (SS) cortex. Mean inter-regional correlation coefficients were greater at the long delays for (B) cortical regions and (C) somatosensory regions (for this, and other comparisons, see Table S3). D. Color-coded matrices showing inter-regional correlations for Fos expression between regions of the prefrontal cortex and other cortical, thalamic and hippocampal regions at the short (1 day) and long (36 days) retention delays. E. Mean correlation coefficients were greater at the long delay, suggesting that medial prefrontal cortex regions play increasingly important roles in memory expression as a function of memory age. F. Color-coded matrices showing inter-regional correlations for Fos expression between hippocampal and cortical regions at the short (1 day) and long (36 days) retention delays. G. Correlation strength increased over time, suggesting that the hippocampus plays a sustained role in memory expression. In all graphs error bars indicate 95% confidence intervals.

