
Figure 1. Determination of transcription factor binding sites and relative binding specificities by in-silico molecular modeling.
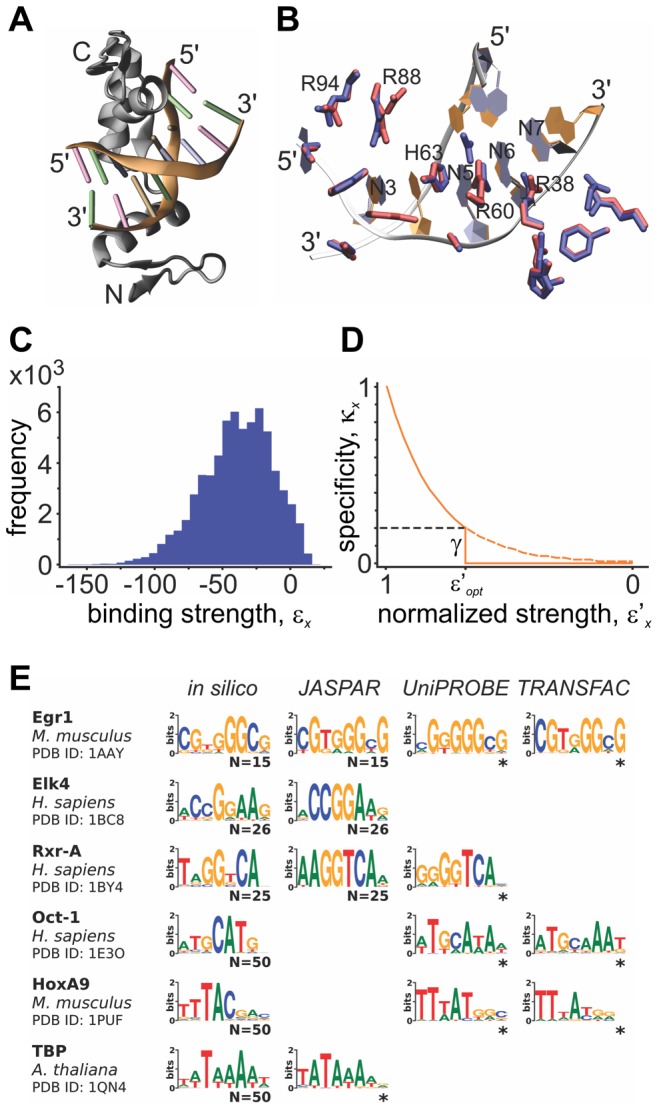
(A) Example of in-silico model of DNA-protein complex for the transcription factor EGR1 (PDB:1AAY, originally with sequence 5′-GCGTGGGC-3′) bound to the candidate 8-mer 5′-CGTTGTCG-3′. DNA color codes: GUA:green, CYT:pink, ADE:blue, THY:orange. (B) Detailed view of same model complex for protein residues at 3.5 Å distance from DNA, showing residue repositioning upon energy minimization procedure. Here, the crystal structure is shown in blue and the model in red. (C) Distribution of calculated binding strengths, ε, using the Robertson-Varani statistical potential on TF-DNA complexes for all possible 8-mers (48) for the Egr1 structure. (D) Transformation of normalized ε scores into relative binding specificities, κ. Dashed line indicates cutoff level γ, below which all specificities are set to zero, providing a variable separation between binding and non-binding 8-mers. ε′opt is a particular value of ε′, defining constant numbers of binding sites for each TF (see Materials and Methods). (E) Six in-silico determined TFBS preferences were compared against those available in JASPAR [23], UniProbe [35] and TRANSFAC [36] databases. N indicates the number of sequences used (we used the N lowest energy sequences to obtain in-silico preferences) to produce the information-content sequence logos (WebLogo [60]). *Logos constructed from frequency matrices.