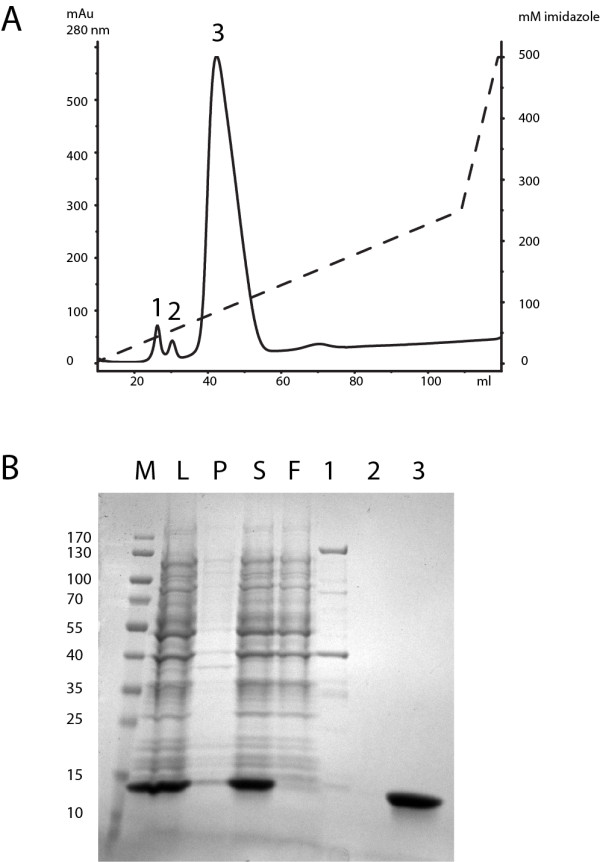
Figure 1.

IMAC purification of an SDS-denatured hexahistitine-tagged protein from inclusion bodies. A Elution profile of a representative protein (173, see Table 1 for details). The x-axis shows the volume in ml during elution of a 5 ml-HisTrap column. The left y-axis shows arbitrary absorbance units at 280 nm, the right y axis shows the concentration of imidazole during elution. Absorbance is shown in a solid line, imidazole concentration as a dashed-line. Three distinct peaks are seen. Samples of these peaks were loaded onto the gel shown in Figure 1B. B Coomassie stained SDS-PAGE gel showing samples of the purification procedure of construct 173. Samples are labeled as follows: M: Molecular weight marker. L: Lysate in PCL buffer after sonication. S: Supernatant after cooling out SDS and centrifugation. F: Combined flowthrough and wash after binding to Ni/NTA Sepharose. 1,2,3 Samples of the three peaks seen in the elution profile shown in Figure 1A.
