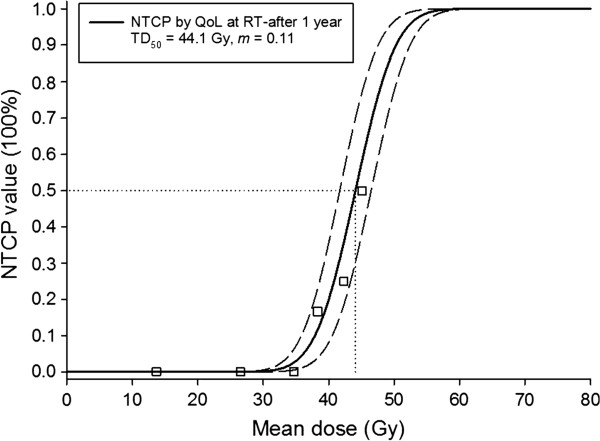
Figure 2.
The observed quality of life (QoL) data and the fitted dose–response curve for the normal tissue complication probability of the incidence of grade 3+xerostomia. (The endpoint was defined as moderate to severe xerostomia 1 year after the completion of RT on the QLQ-HN35 questionnaires). Dashed lines show 95% confidence intervals for the model fit to the QoL data (solid line). The squares represented the average probability for groups of patients in bins 4-Gy width. (All individual data points were used in the NTCP fitting).

