
Figure 6. Distribution of single nucleotide polymorphisms in a mutation-accumulation experiment.
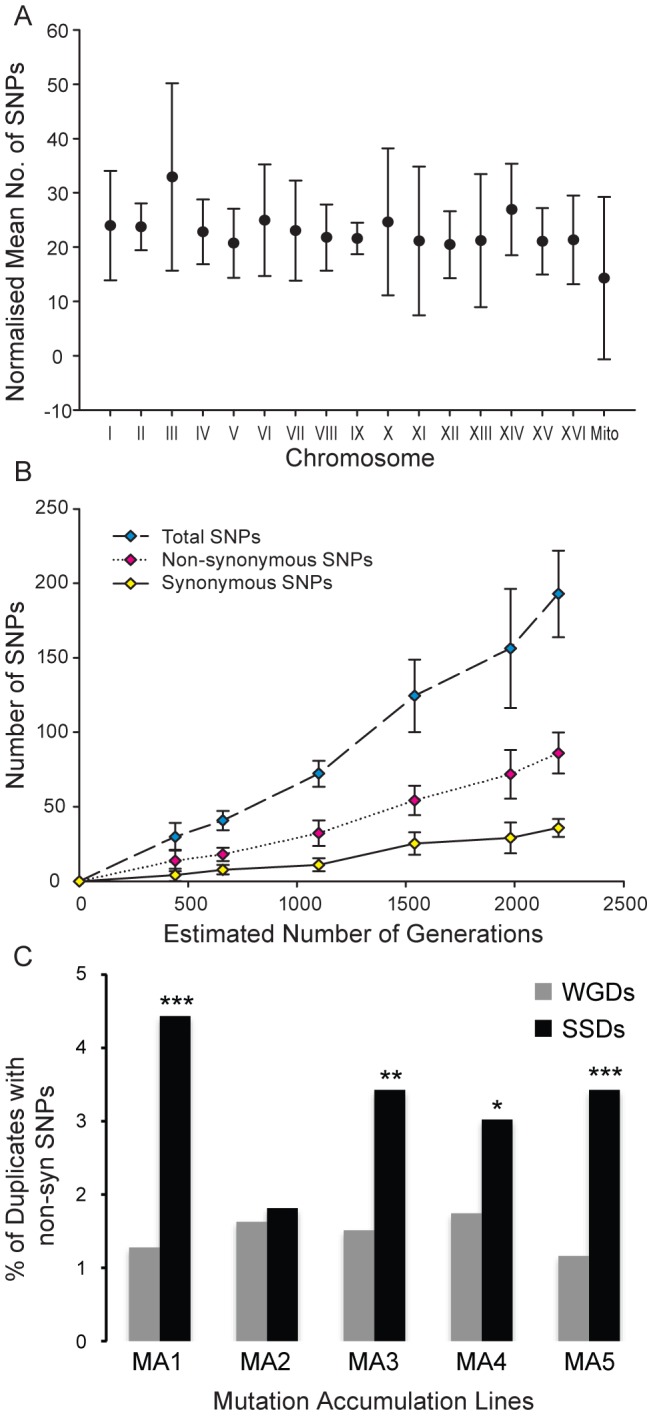
(A) Normalized mean number of single nucleotide polymorphisms (SNPs) per chromosome after experimental evolution of 5 S. cerevisiae lineages for up to 2200 generations. The number of SNPs per chromosome was normalized by length to that of the longest chromosome (chrIV) and error bars represent the standard deviation. (B) The number of SNPs detected in the genome of each lineage increased linearly with the number of generations for total, non-synonymous and synonymous SNPs. (C) The fraction of SSDs (black columns) and WGDs (grey columns) affected by non-synonymous single nucleotide polymorphisms (Nsyn-SNPs) across the five mutation-accumulation (MA1 to MA5) experimental lines. In all five MA lines, the fraction of SSDs with Nsyn-SNPs is larger than that of WGDs. The fraction of SSDs that have fixed Nsyn-SNPs is significantly larger than that of WGDs in four of the five MA experimental lines (significance is indicated by * = P<0.05; ** = P<0.01 and *** = P<0.001).