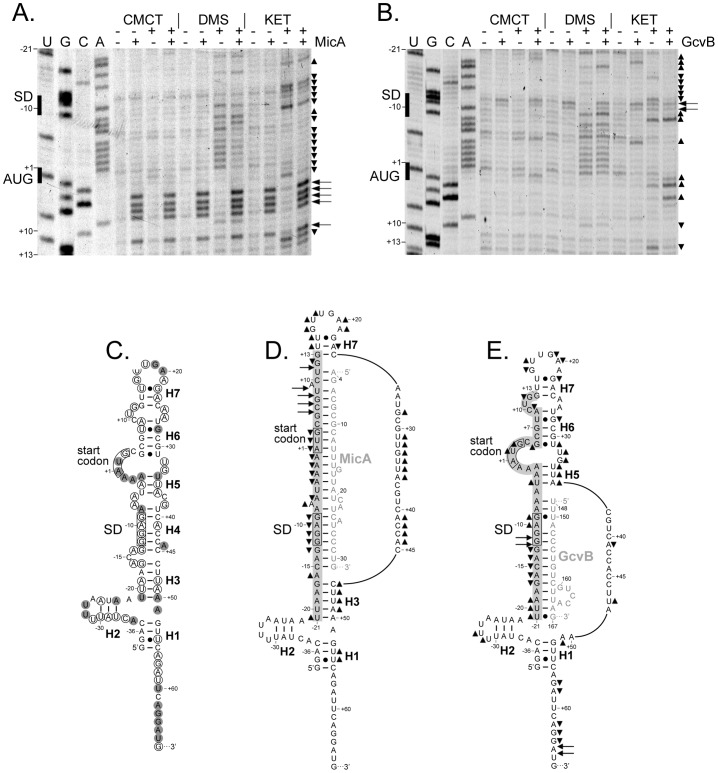
Figure 4. In vitro structural probing of phoP mRNA alone and in the presence of MicA or GcvB.
(A, B) Representative gels showing structure probing of phoP mRNA using DMS, CMCT and kethoxal (KET) in the presence and absence of MicA (A) or GcvB (B) sRNA. Nucleotides are numbered according to position +1 which corresponds to the first nucleotide of phoP ORF. The locations of the SD sequence and phoP translation start codon are shown on the left of the gels. Up and down triangles on the right of the gels indicate increased or decreased reactivity upon sRNA addition, respectively, while the arrows denote sRNA-induced RT-stops or pauses. (C) Secondary structure model of the 5′ region of phoP mRNA. Nucleotides are numbered as in (A, B). Position −36 indicates the transcription initiation site from the P1 promoter. The seven double-stranded elements which hold the secondary structure of the 5′ region of phoP mRNA are denoted by H1 to H7. Nucleotides displaying weak and moderate or strong reactivity towards the chemical probes are indicated by empty or grey circles, respectively. The SD sequence and phoP translation start codon are boxed. (D, E) Summary of the reactivity shifts displayed by phoP mRNA nucleotides upon addition of MicA (D) or GcvB (E). The duplex models are derived from the base-pairing interactions shown in Figure 3 which have been altered according to the structural constraints provided by the probing data. The SD sequence and phoP translation start codon are boxed. The phoP mRNA nts highlighted in grey correspond to the region −21 to +13 whose probing is shown in panels A and B. sRNA-induced reactivity shifts and RT-stops or pauses are indicated as above (A, B). Nucleotides of both sRNAs are indicated in grey.

