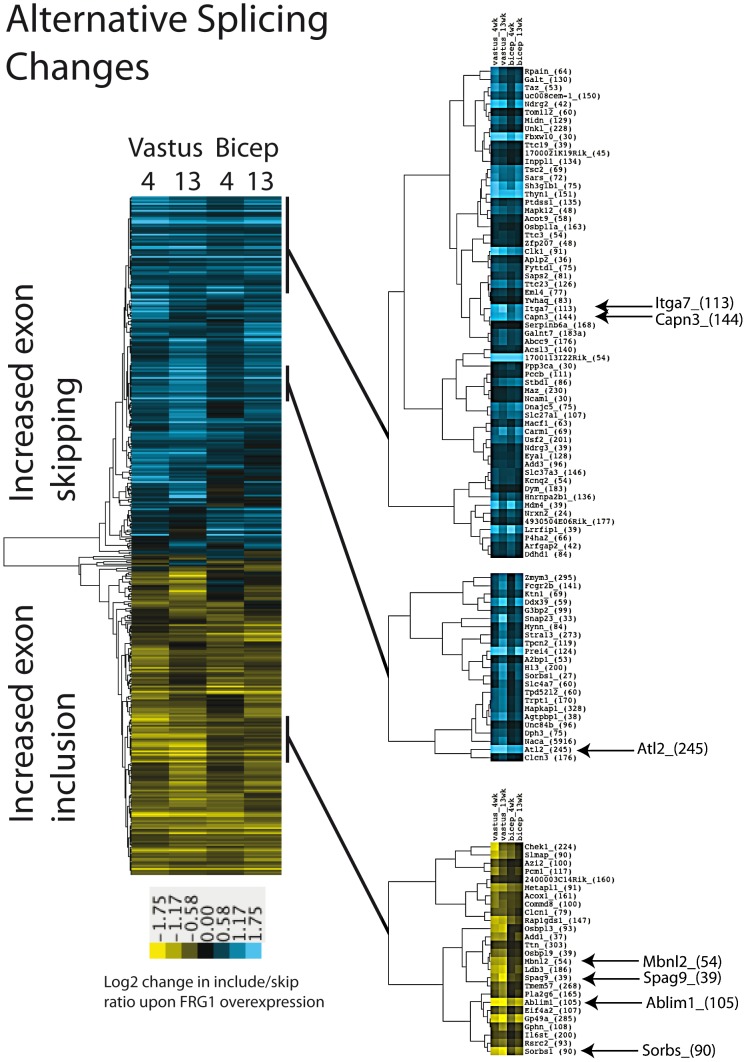
Figure 3. Alternative splicing changes in muscles of mice over-expressing FRG1.
Average linkage clustering was applied to alternative cassette exon splicing events with |Sepscore|≥0.3 in at least one of the four comparison datasets (q = 0). Selected nodes are expanded on the right. Exons which shown increased inclusion in FRG1 over-expressing muscles are shown in yellow in the heatmap, while exons with decreased inclusion are represented in blue.

