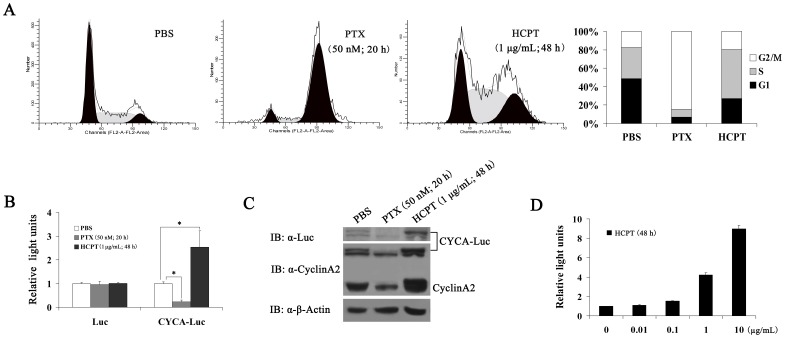
Figure 4. CYCA-Luc accumulates in response to S-phase-specific drug.
(A) Proportion of cells accumulated in S-phase following S-phase-specific drug (HCPT) treatment or M-phase-specific drug (PTX) treatment. U2OS-CYCA-Luc cells were analyzed for DNA content by FACS after propidium iodide staining, or were lysed, after treatment with PBS (20 h), HCPT (1 µg/mL; 48 h), or PTX (50 nM; 20 h). (B, C) Cell extracts were analyzed by immunoblotting (B) or assayed for luciferase activity (C). (D) After treatment with HCPT (0, 0.01, 0.1, 1 and 10 µg/mL) for 48 h, HeLa-CYCA-Luc cells were lysed, and cell lysates were assayed for luciferase activity. For normalization of CYCA-Luc activity or Luc, the signal (1 µg protein) for untreated cells was set to 1. This experiment was repeated three times (n = 3); error bars indicate standard error; *, p<0.05 compared with PBS.

