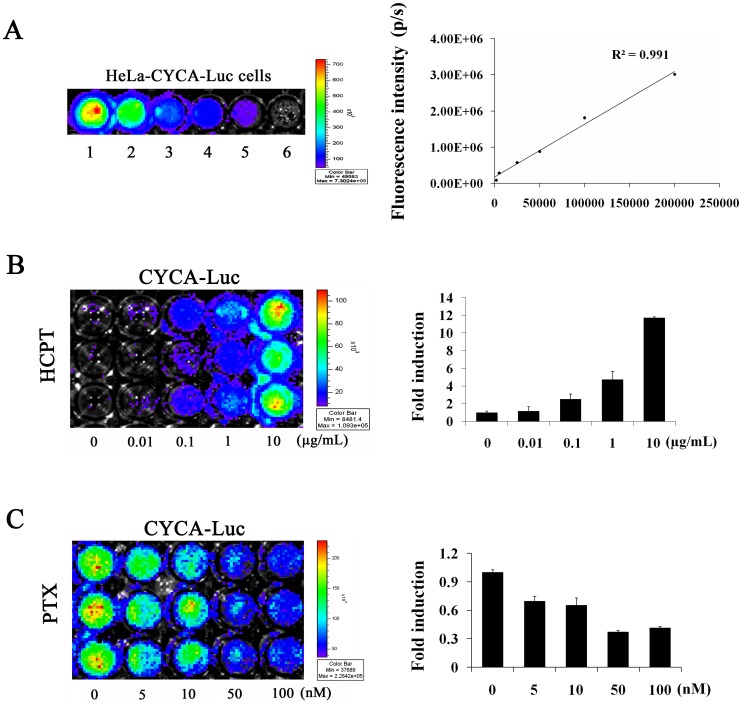
Figure 5. Induction of CYCA-Luc by S-phase-specific drug in vitro.
(A) HeLa-CYCA-Luc cells were serially diluted, placed into wells of a 96 well plate, and immediately imaged using the IVIS Lumina imaging system to obtain FLUX measurements (left, images). These data were averaged (n = 3) and used to generate a plot comparing total flux to cell number (right, graph). (B, C) HeLa-CYCA-Luc cells were placed into wells of a 96 well plate. Images were obtained after 48 h treatment with HCPT (0, 0.01, 0.1, 1, and 10 µg/mL) (B), or 20 h treatment with PTX (0, 5, 10, 50 and 100 nM) (C). Left, cellular images obtained after treatment with HCPT or PTX. Right, normalized fold induction of CYCA-Luc or Luc treated with the indicated doses of drugs. For normalization of luciferase or CYCA-Luc activity, the signal for untreated cells was set to 1. Quantitative data represent the mean ± standard error (n = 3 per group).

