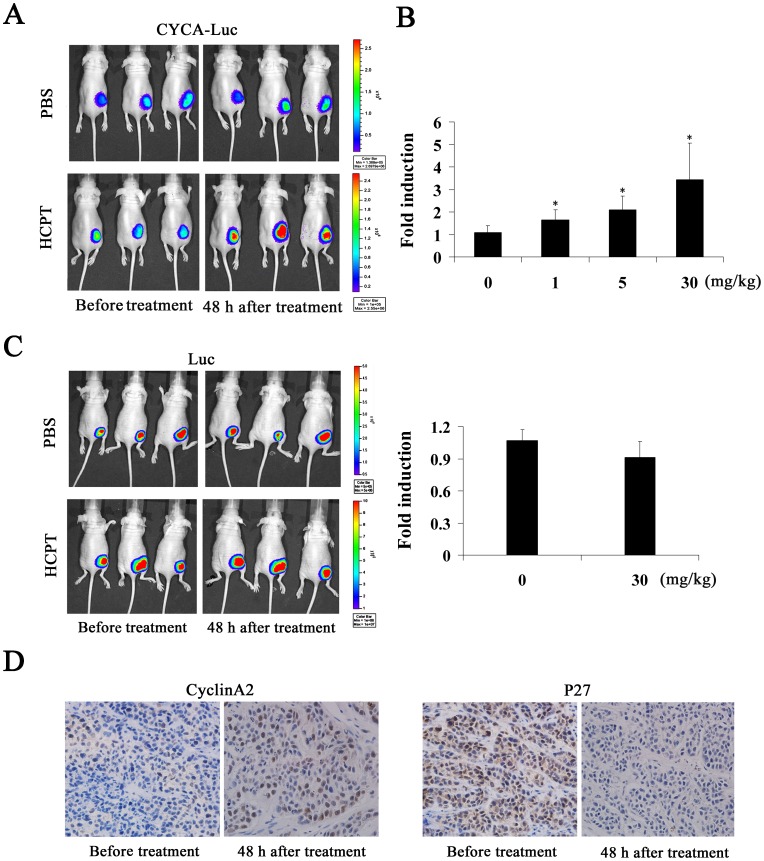
Figure 6. Monitoring S-phase-specific drug in vivo using bioluminescent imaging.
(A, C) 1×10⁷ HeLa-CYCA-Luc cells or HeLa-Luc cells in 0.2 mL PBS were injected subcutaneously into each flank of BALB/C nude mice under anesthesia (isoflurane). (A) Left, Bioluminescent images were obtained 3 weeks later, when tumors of comparable size (∼5 mm) had formed bilaterally. Right, repeat images were obtained 48 h after intraperitoneal injection of HCPT (30 mg/kg). (B) Normalized fold induction of CYCA-Luc in mice treated with the indicated doses of HCPT (four mice per treatment group). (C) Normalized fold induction of Luc in mice treated with the indicated doses of HCPT (four mice per treatment group) and imaged as in A. (B, C) Fold induction was calculated as CYCA-Luc/Lucpost-treatment ÷ CYCA-Luc/Lucpretreatment. Error bars indicate standard error; *, p<0.05 compared with PBS. (D) Representative immunohistochemical images of cyclin A2 and p27. Tumor sections were obtained 48 h after initial injection of 30 mg/kg HCPT (n = 4 per group). The representative images were taken at an original magnification of 200×.

