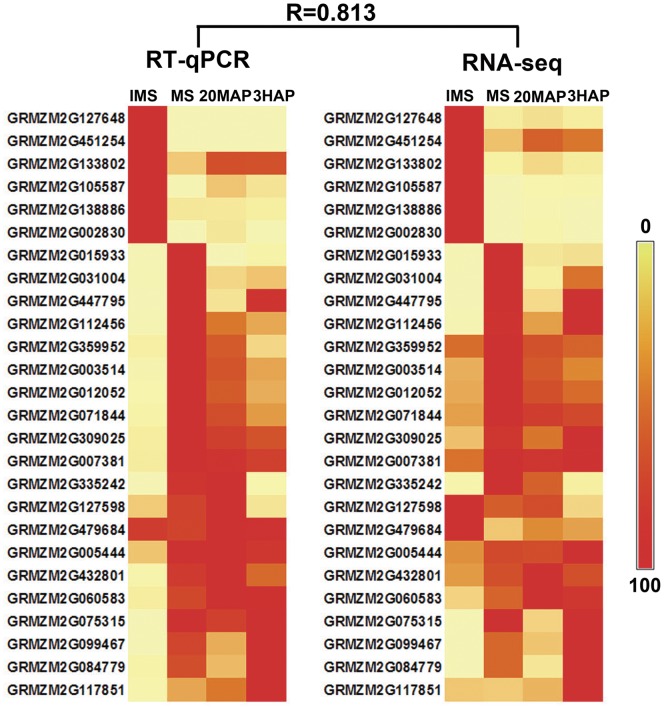
Figure 7. Validation of RNA-seq results by RT-qPCR.
Expression levels of 26 randomly selected genes in the four samples used in this study were detected by RT-qPCR. Heat map (left) was constructed using mean values of expression levels derived from three biological replicates. Normalized RPKM values of RNA-seq results are shown (centre). For each gene, the maximum expression in a certain sample was set to 100, and relative expression levels in the other samples were calculated according to this maximum level. Relative expression is shown by colour scales as indicated on right. R represents the correlation coefficient value between the two platforms.

