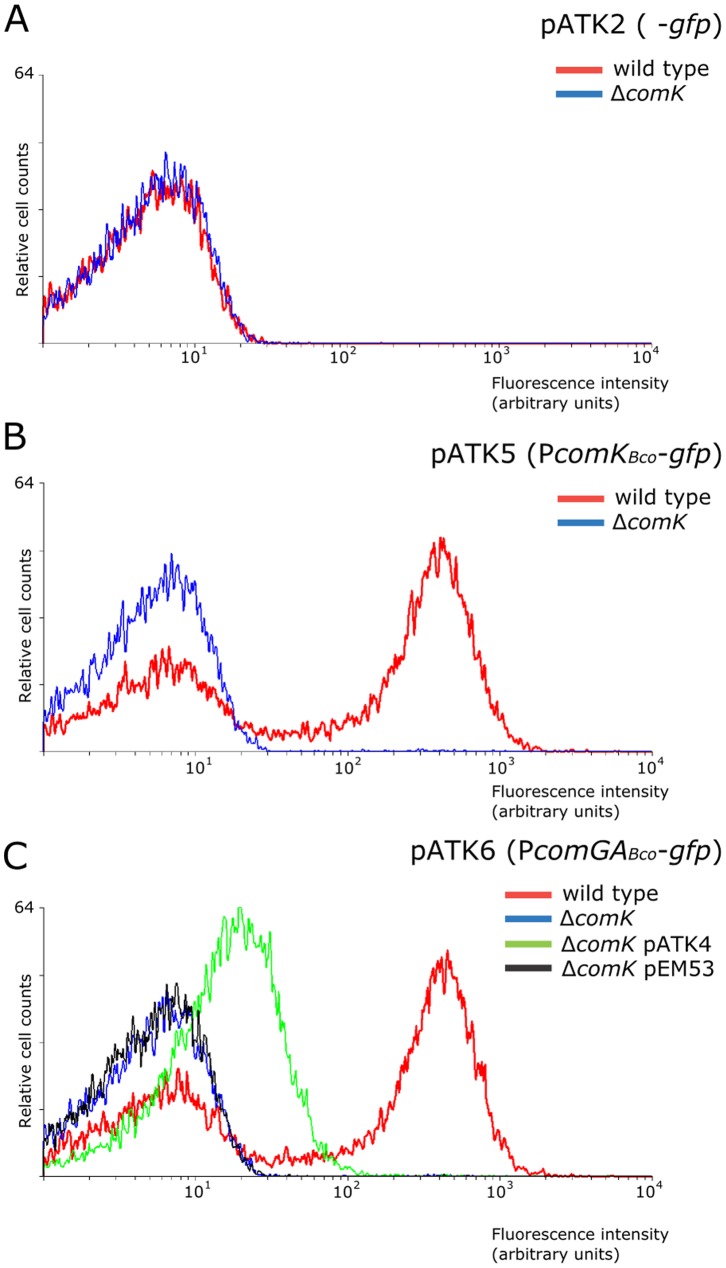
Figure 3. Expression from the comKBco and comGABco promoters in B. subtilis.
Single cell analysis of B. subtilis strains containing plasmids with promoter-less gfp (A), with PcomKBco-gfp fusion (B), and the PcomGABco-gfp reporter (C). Samples were taken at the indicated time points given in hours relative to the transition point between the exponential and stationary growth phase (T0). The single cell expression pattern in the wild type strain is indicated with light grey, the ΔcomK mutant is designated with dark grey, and the ΔcomK strain with the comKBco containing plasmid pATK4 is shown in white. The relative numbers of cells are indicated on the y axis, and their relative fluorescence levels are indicated on the x axis on a logarithmic scale. For each experiment at least 20,000 cells were analyzed. The graph is the representative of at least three independent experiments.

