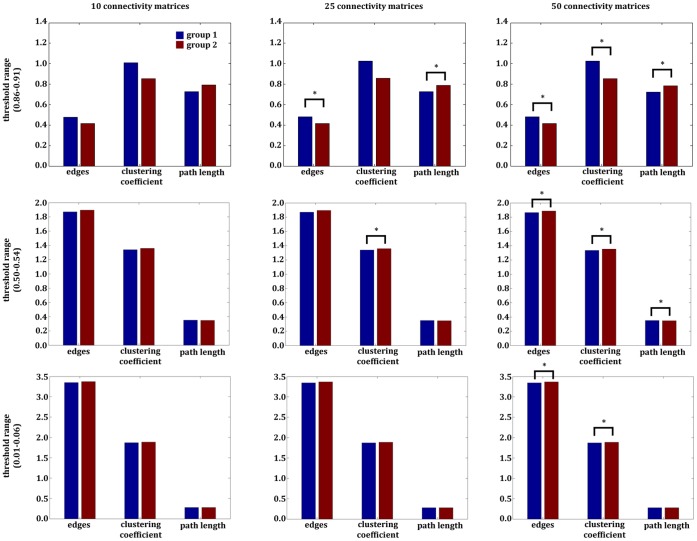
Figure 3. Results of the multiple-thresholds-approach of the example with the artificial data.
Displayed are the results of the second example, which used artificial data. The comparison of the two networks, based on artificial data, revealed several significant differences. Depending on the number of thresholds (defining the different measurement units within each group) and the threshold range used for the comparison, completely distinct results could be obtained. For an optimized display, the numbers of edges were scaled (number of edges divided by 1000).

