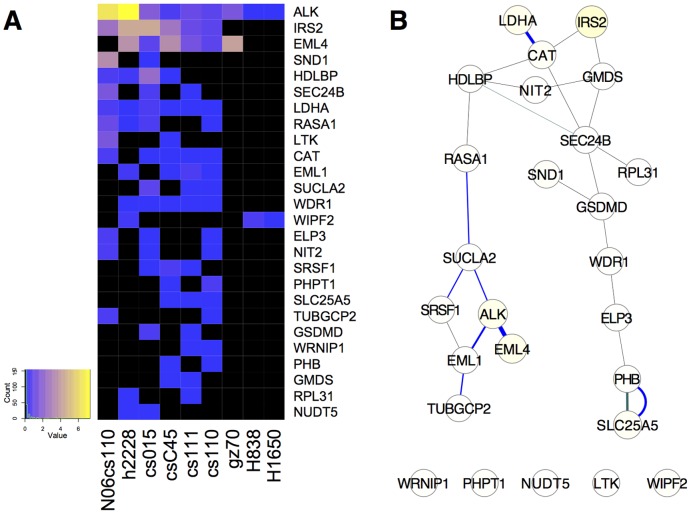
Figure 5. Filtered cluster containing ALK, graphed as a heat map.
(A) and protein-interaction network (B). This cluster is derived from clusters combined from Figure S8B and C in which proteins present in a single sample, or samples containing a single gene, were filtered. This cluster had twelve-fold more edges, ten-fold greater edge weight than the average random cluster, and 7 more edges than would be expected from these nodes in the entire lung cancer network. Individual edges are shown from String (blue) and GeneMANIA (black).

