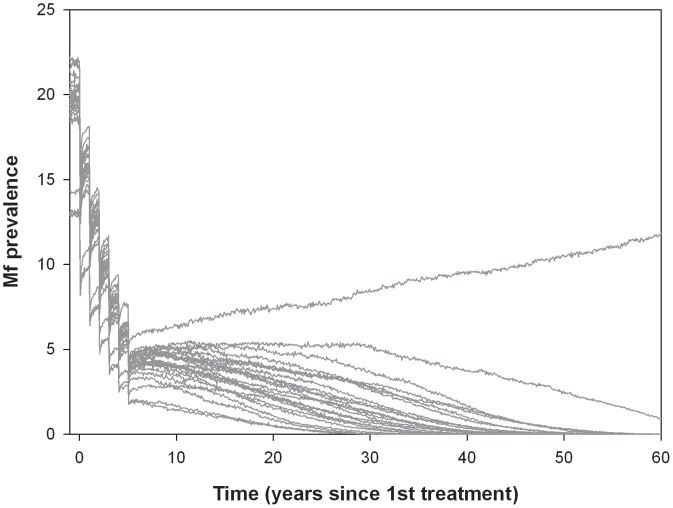
Figure 1. Simulated trends in mf prevalence (%) after mass drug administration.
The presented trends are for an African setting with pre-control mf prevalence around 20%, where 6 rounds of annual mass drug administration with IVM+ALB were provided starting at time 0. Coverage was 70% and drug efficacy was quantified according to our baseline assumptions. The figure displays the trend of 25 runs, simulated by LYMFASIM, all with the same input assumptions. Variation in the outcomes is due to stochasticity.

