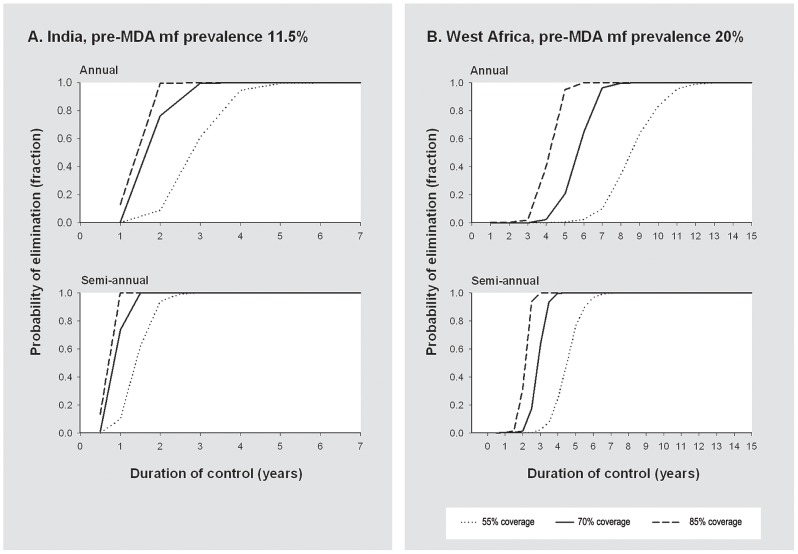
Figure 2. Probability of elimination in relation to the duration of mass drug administration.
Panel A shows the results for an Indian setting with a pre-control mf prevalence of about 11.5%, for annual and semiannual mass drug administration and for different coverage levels (percentage of the total population that is treated per round). Similarly, panel B shows the results for an African setting with a pre-control mf prevalence of about 20%. The indicated mf prevalence levels are for diagnosis with 60 µL night blood smears.

