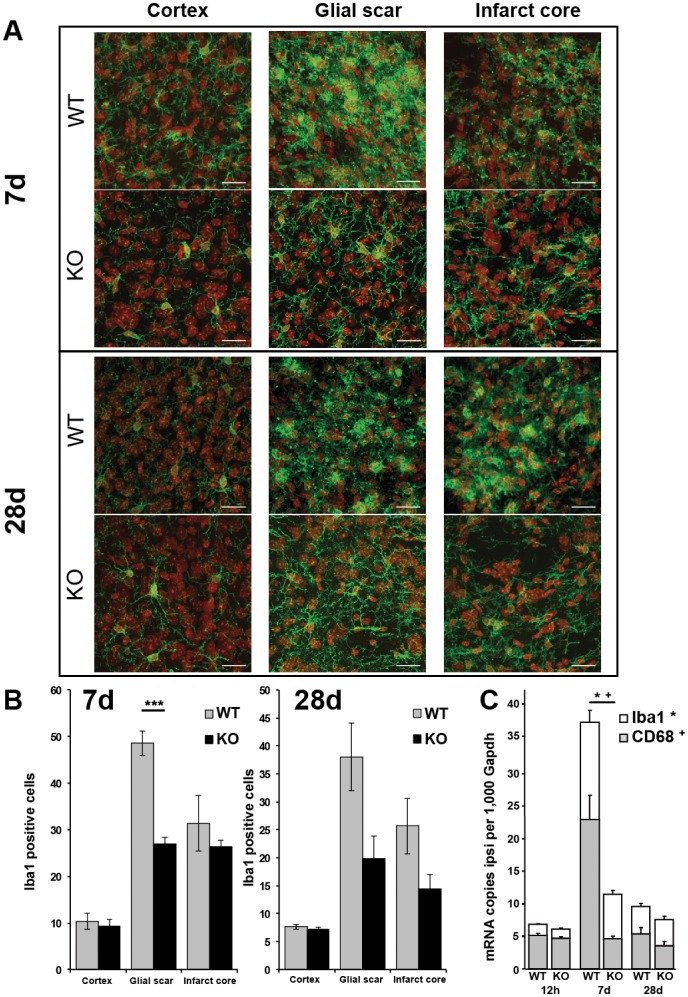
Figure 2. Decreased microglial activation in TREM2-KO mice after stroke.
A. Post-ischemic Iba1 positive cells (green) displayed the typical activated amoeboid phenotype in the glial scar and infarct core at 7 d and 28 d in WT mice, whereas they remained in a ramified phenotype in TREM2-KO mice. Nuclei of cells counterstained with DAPI (for a better distinction the color was changed to red). Scale bar 20 µm. B. Fewer Iba1 positive activated microglial cells were revealed in the glial scar of TREM2-KO mice (KO) at 7 d following stroke compared to littermate controls (WT). Bars represent mean ± s.e.m., n = 5/6 each, WT ipsi vs. KO ipsi ***p≤0.001. C. Gene transcripts for Iba1 and CD68 were determined at 12 h, 7 d and 28 d after stroke in TREM2-KO mice (KO) and littermate controls (WT). Attenuated gene transcription of Iba1 and CD68 was observed 7 d after stroke in TREM2-KO (KO) mice compared to control (WT) mice. Bars represent mean ± s.e.m. (mRNA copies per 1,000 Gapdh), n = 5/6 each, WT ipsi vs. KO ipsi *p≤0.05 (Iba1), +p≤0.05 (CD68).

