
Figure 5. No change in brain tissue injury in TREM2-KO mice after stroke.
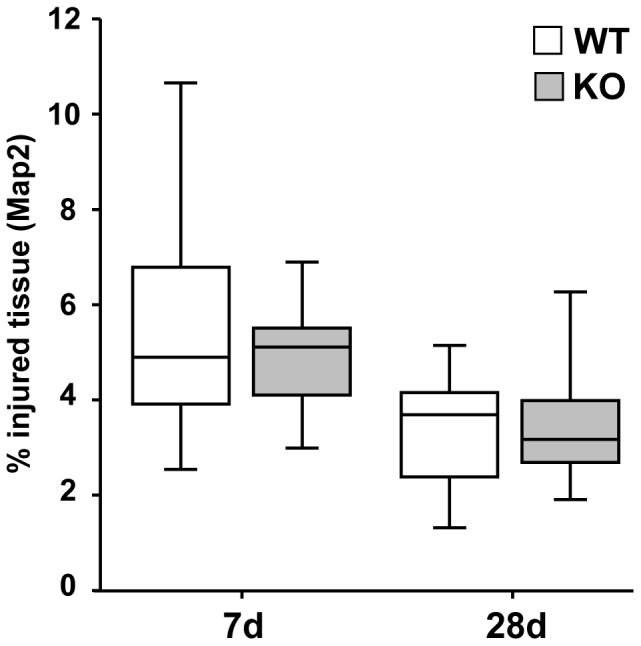
Infarct volumes of TREM2-KO and littermate control mice were analyzed at 7 d and 28 d based on Map2 immunohistochemistry. TREM2-KO mice and littermate control mice showed the same relative loss in Map2 immunostaining as a sign of tissue injury. Box and whisker plots represent mean ± s.e.m. (mm3 injured tissue vs. ipsilateral hemisphere in %), n = 9–14 each.