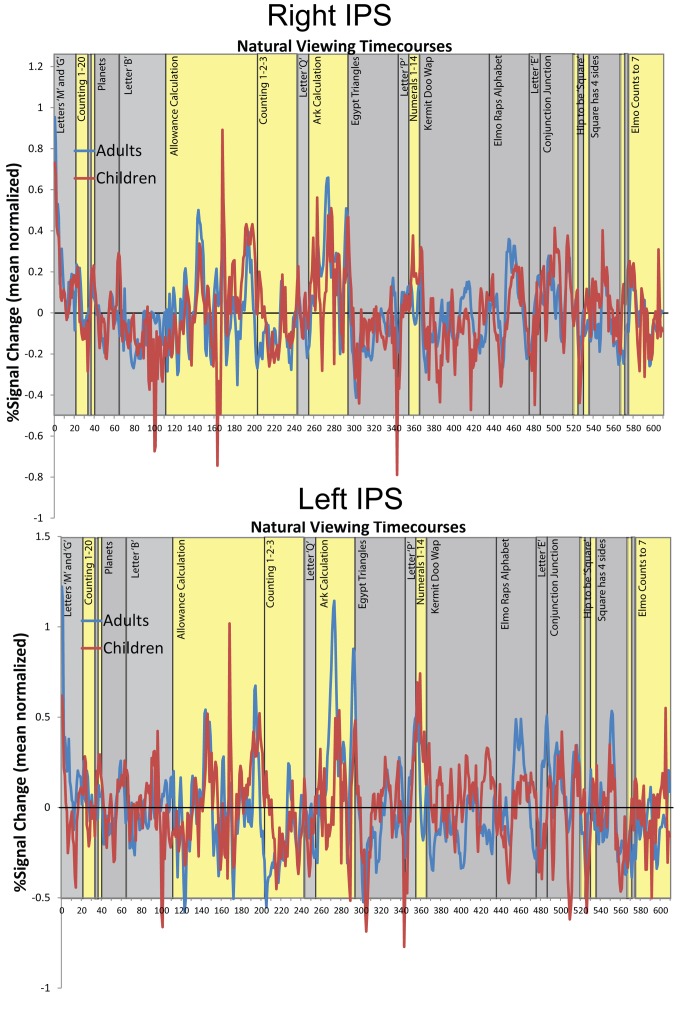
Figure 3. BOLD timecourses of activation from the IPS regions from adults (blue) and children (red) from the video series.
The timecourses are averaged across the IPS voxels from Figure 2A. Percent signal change is calculated relative to the mean amplitude of the timecourse (the zero ordinate represents mean amplitude). The yellow bars indicate time periods where numerical information was presented in the video and the gray bars represent non-numerical video segments. The timecourses illustrate the correlation between the neural responses of children and adults.

