
Figure 5. Average intersubject correlation for adults-to-adults and children-to-adults in each of the three ROIs from Figure 2 : right IPS, left IPS, and Broca's area.
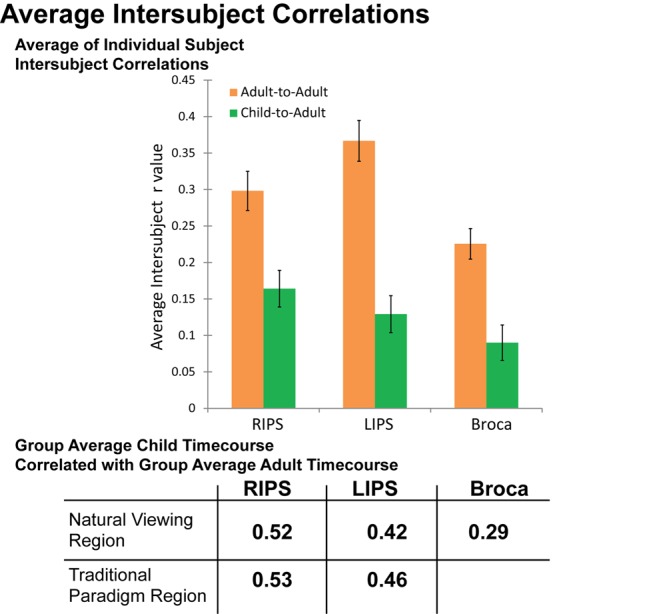
In the top panel, intersubject correlations were calculated between each subject and the group mean (never including a subject's own data in the group mean for adult-to-adult correlations). In the bottom panel, the chart presents the correlation values when the correlation is calculated over the group mean timecourses for each region. The correlations were calculated across the 609 timepoints shown in Figures 3 and 4.