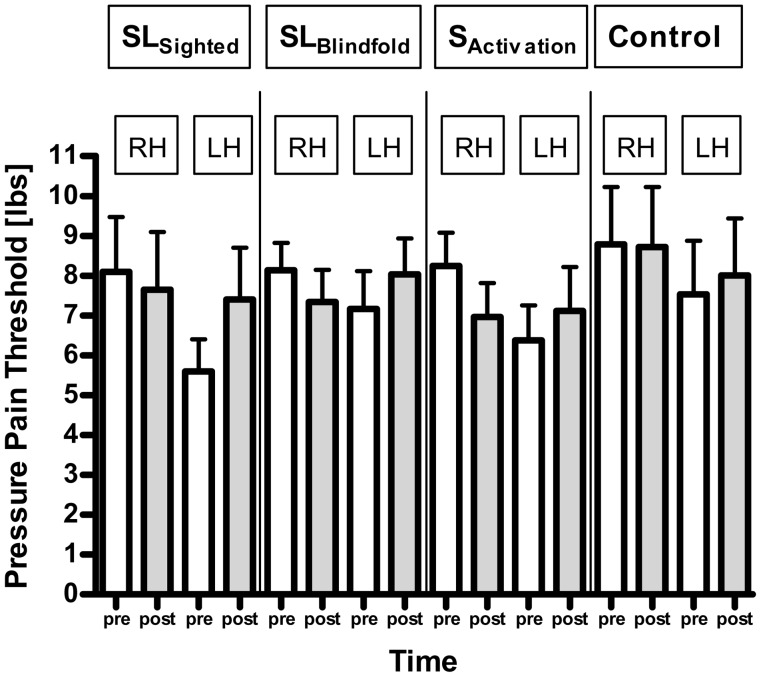
Figure 3. Pressure pain threshold levels.
Pressure pain threshold levels before and after the interventions of the left (target to sensory tasks) and right hand for all four study groups (SLsighted, SLblindfold, Sactivation, control). Errors bars show standard error of the mean. RT: right hand. LT: left hand.

