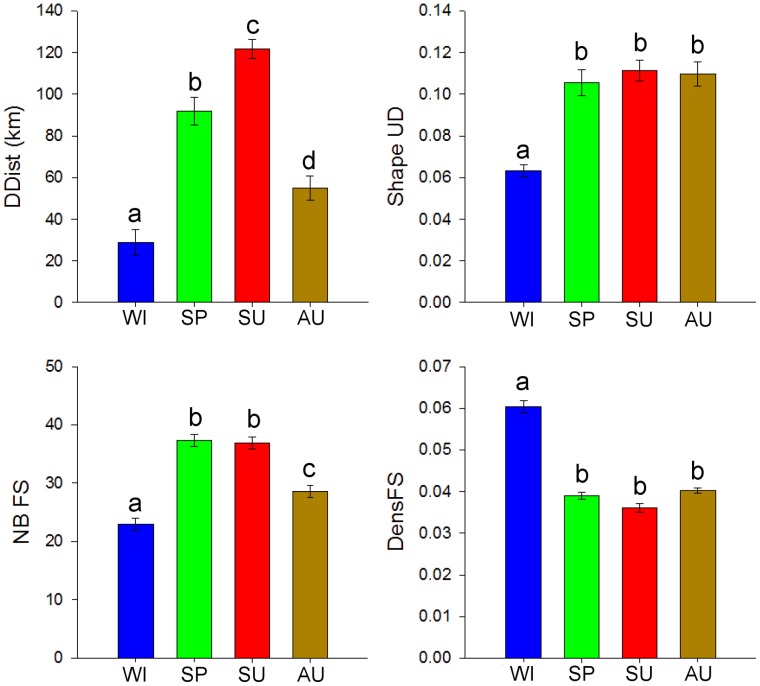
Figure 3. Seasonal differences between the four analyzed variables.
Seasonal differences in mean distance covered per day (DDist, in km), flatness of the UD (ShapeUD, corresponding to the ratio core area/home range area), number of feeding stations whithin the home range (NbFS) and density of feeding stations within home range (DensFS, in NbFS per km2). The values correspond to estimates (mean±SEM) provided by a GLMM (see Table 2). Letters indicate groups determined by post-hoc tests. WI = winter, SP = spring, SU = summer, AU = autumn.

