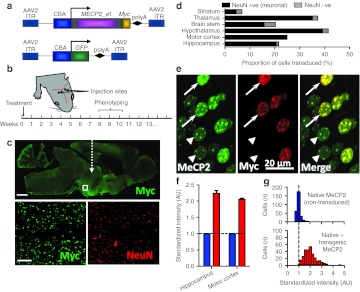
Figure 1.
Widespread expression of exogenous MeCP2 across the brain following neonatal delivery via an AAV2/9 vector. (a) MECP2_e1/Myc fusion and GFP (control) constructs were cloned into AAV2 backbones under a CBA promoter. (b) Experimental plan in which male wild-type (WT) or Mecp2−/y mice were injected intracranially with AAV9/CBA-MECP2 at P0-2, scored for the progression of RTT-like signs from 3 weeks onwards and phenotyped quantitatively at weeks 8–10. (c) Representative micrograph (whole brain, parasagittal section) showing the distribution of Myc-tagged MeCP2 expression in a 12-week-old WT mouse following bilateral injection. White dashed arrow indicates approximate injection site. Insets are higher power micrographs corresponding to the box in the large image showing proportion of Myc +ve (transduced cells) relative to the NeuN-immunolabeled cell population. (d) Quantification of transduction efficiency (as a proportion of DAPI-stained nuclei) revealed widespread, mainly neuronal, distribution across a range of CNS regions. (e) Micrograph showing transduced and non-transduced cells in hippocampal area CA3 in a WT male mouse. At a cellular level, exogenous MeCP2 (revealed by Myc immunoreactivity) was localized to neuronal nuclei with a punctate distribution characteristic of proteins that colocalize with heterochromatin. (f) Injection of AAV9/MECP2 into WT mice led to augmentation of MeCP2 levels (native + transgenic) in transduced cells and enabled quantification of relative transgenic MeCP2 abundance. Blue bars show native MeCP2 levels in non-transduced cells and red bars show levels of native + transgenic MeCP2 in transduced cells. Transduced cells exhibited mean levels of anti-MeCP2 immunofluorescence that were 105–124% higher than mean basal levels in untransduced nuclei. (g) Distribution of MeCP2 level (immunofluorescence intensity) in transduced and non-transduced layer of V pyramidal cells (primary motor cortex) from four injected brains. Analysis revealed native MeCP2 levels to be tightly regulated (narrow peak) while levels in transduced cells showed a broader and positively shifted distribution. Bars: c, top, 1 mm; c, bottom, 100 µm. Error bars show mean ± SEM. AAV, adeno-associated virus; AU, arbitrary unit; CBA, chicken β-actin; CNS, central nervous system; DAPI, 4′,6-diamidino-2-phenylindole; GFP, green fluorescent protein; ITR, inverted terminal repeat; NeuN, “neuronal nuclei” antigen (Rbfox3); polyA, SV40 polyadenylation signal; RTT, Rett syndrome.

