Figure 1.

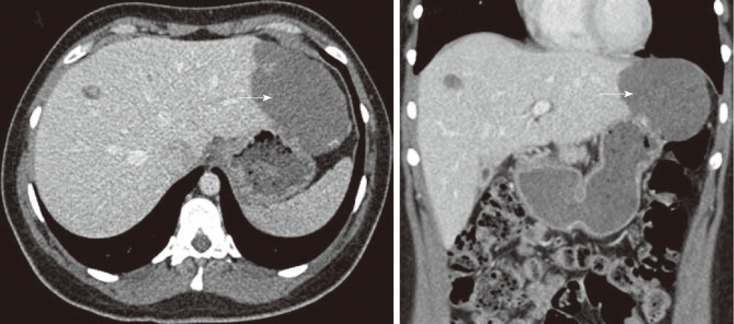
Axial section (A) and coronal section (B) of enhanced portal-phase computed tomography scan showing multiple haemangiomas of the left and right liver lobes, the largest (arrow) in segments 2 and 3 measuring 10 cm in diameter.

Axial section (A) and coronal section (B) of enhanced portal-phase computed tomography scan showing multiple haemangiomas of the left and right liver lobes, the largest (arrow) in segments 2 and 3 measuring 10 cm in diameter.