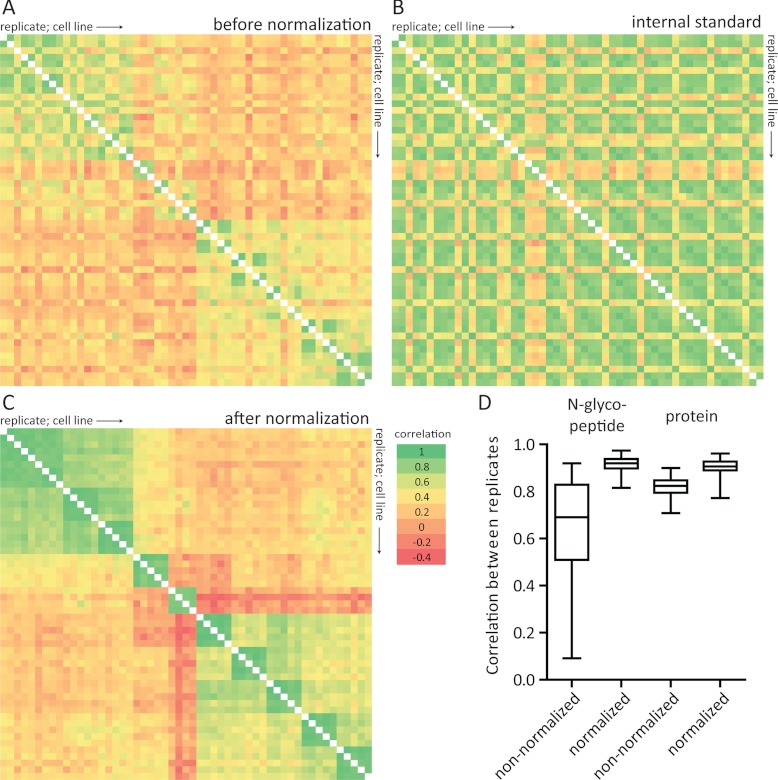
Fig. 3.
Effect of normalization using the super-SILAC internal standard. A, Correlation of intensities of light N-glycosylated peptides intensities between different replicates and cell lines (light channel of SILAC measurements only). Samples are ordered horizontally and vertically according to replicates and cell line (from HMEpC1 until MDA-MB-453). B, Correlation of intensities of heavy isotope labeled N-glycosylated peptides (super-SILAC internal standard) intensities between different replicates and cell lines. C, Correlation of N-glycosylated peptide ratios between different replicates and cell lines after normalization using the super-SILAC internal standard. Correlations between replicates (“green blocks” near the diagonal) and cell lines from the same cancer stages are increased, whereas differences with other cell lines are augmented. D, Correlation between replicates from each cell line at the N-glycosylated peptide level (from panel A and C) and protein level (based on nonglycosylated and glycosylated peptides) before and after normalization using the super-SILAC internal standard. Pearson's r was calculated between all replicates from each cell line. Two aberrant measurements (one from HMEpC2 and one from HCC1937) were omitted.

