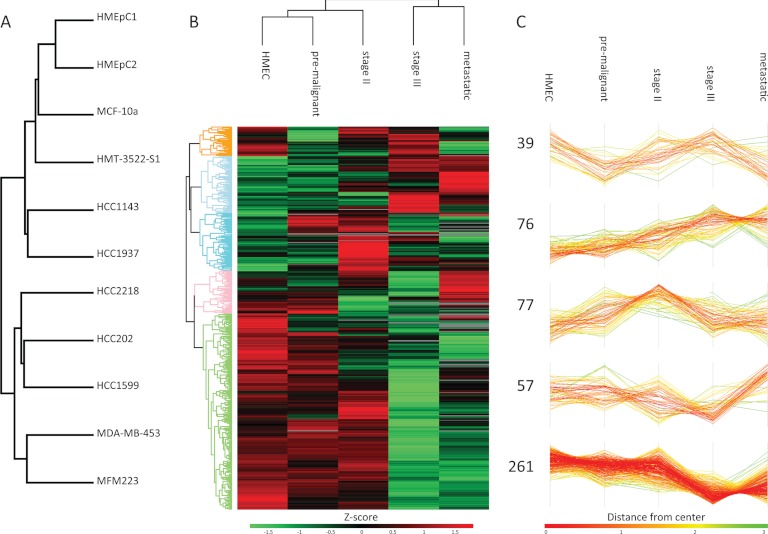
Fig. 4.
Hierarchical clustering of N-glycosylation abundance profiles. A, Hierarchical clustering based on Euclidean distance at the cell line level. B, Hierarchical clustering based on Euclidean distance at the cancer stage level of N-glycosylation sites that showed a significant difference between healthy mammary epithelial cells (HMEC) and at least one other cancer stage. C, Five main clusters extracted from B).

