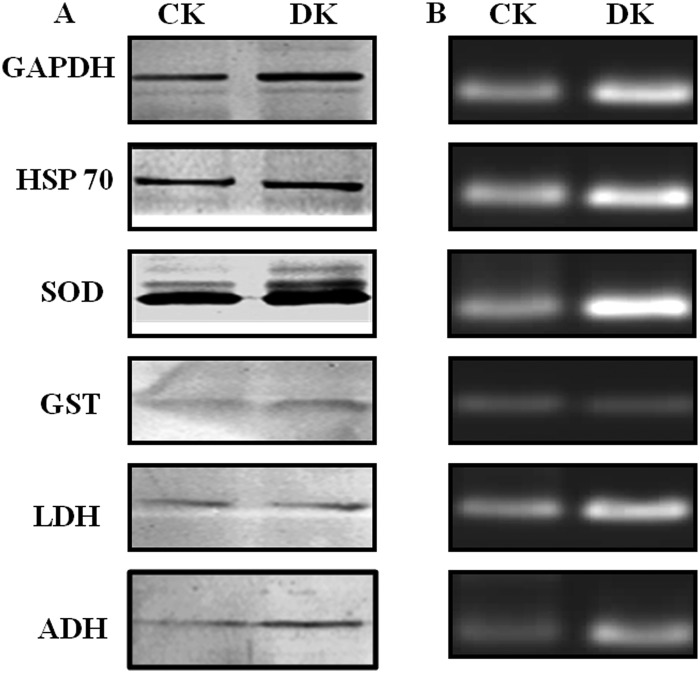
Fig. 7.
Expression analysis of PRPs. A, Protein expression of GAPDH, HSP 60, SOD, GST, LDH, and ADH in control (CK) and diabetic (DK) rat kidney was measured by the Western blot analysis. B, The same proteins were analyzed at the transcript level by performing semi-quantitative RT-PCR using total RNA isolated from control and diabetic rat kidney tissues. All samples were analyzed on 2% agarose gels containing gel red. Both analyses showed up-regulation of PRPs in diabetic condition. Results shown are representative of three independent experiments.

