Fig. 5.
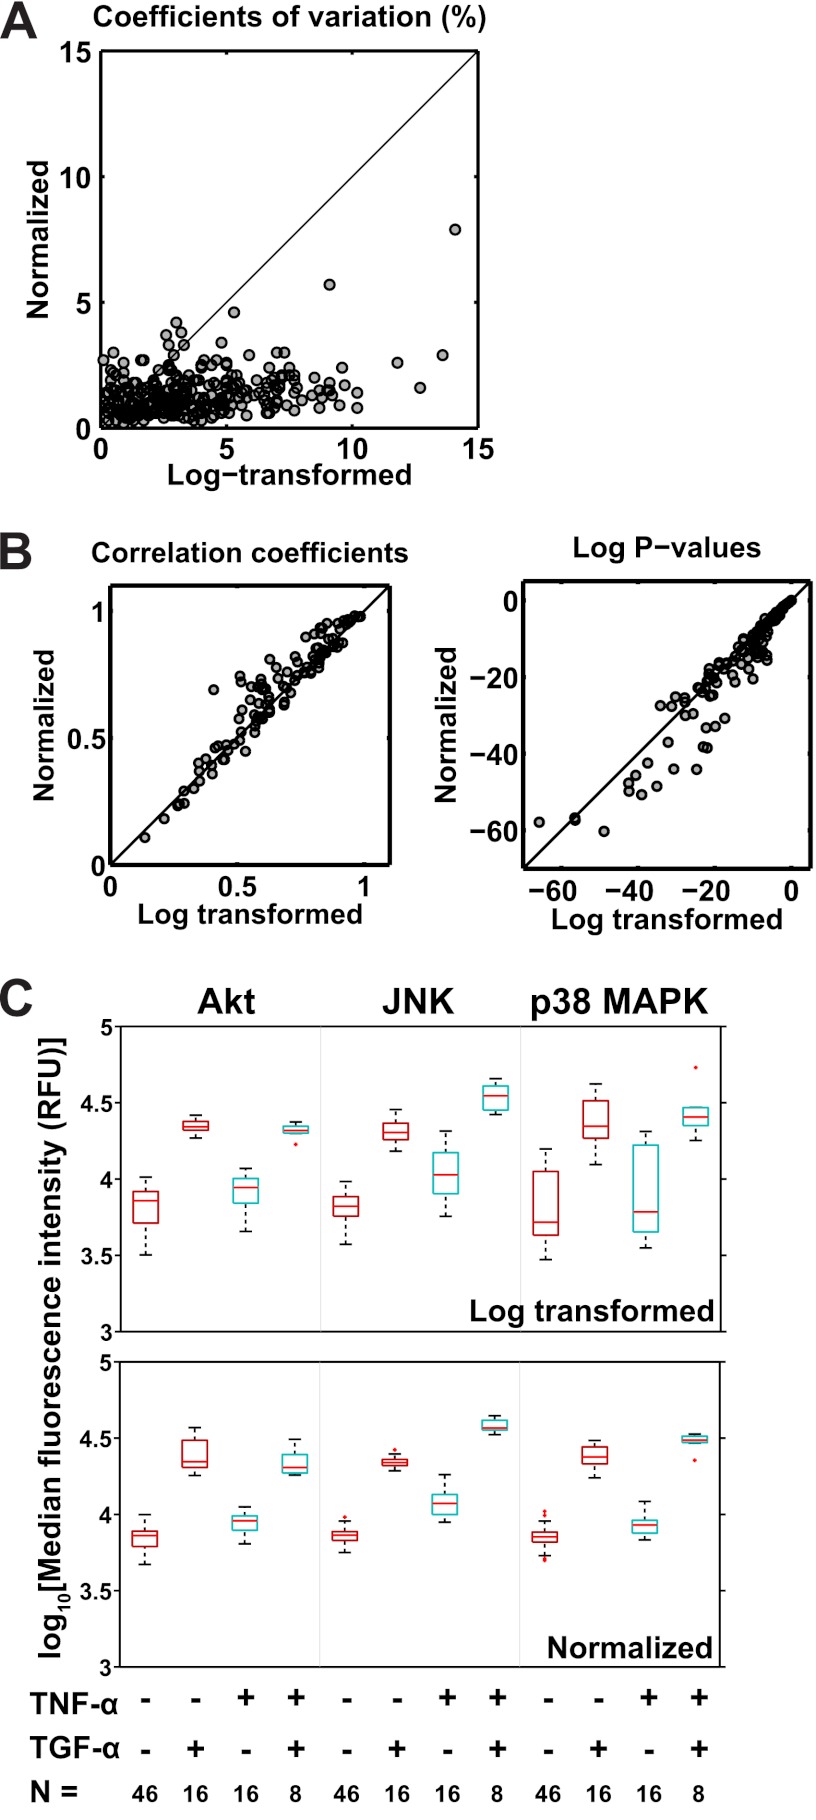
The effect of normalization on the precision and sensitivity of multiplexed bead-based immunoassays. A, Scatterplot of the coefficients of variation (CVs) of replicate data for both log-transformed and normalized data. Each data point represents a CV calculated from the replicates of a particular observation, with n = 4, 7, or 8 depending on the condition (see text for details). B, Scatterplots of the Pearson correlation coefficients (left) and corresponding p-values (right) for each pair of analytes from the log-transformed (left) and normalized data (right; n = 162 = 256 points per plot). C, Illustration of the effect of data normalization on testing for statistical significance. The upper and lower panels feature boxplots from the log-transformed and normalized data, respectively, that show the effect of TNF-α and TGF-α factorial treatments on MFIs for Akt, JNK and p38 MAPK. Akt is shown because it is the basis for comparison in the mixed-effects model. n = the number of observations contributing to the corresponding boxplot above. The boxplots for the normalized data are generally shorter than those for the log-transformed data and thus indicate reduced variability. The details of the boxplot construction are presented in the Materials and Methods section.

